jupyter notebookで触れるプロットを描く
昔、Emacsから使えないからjupyter notebookは使わないという旨の記事を書いた。 実際まだ、Emacsからは使えていないけど、最近はだいたいのコードをEmacs+pythonで書いて、実行やグラフを描く部分をjupyter notebookでやるということをよくやっている。
jupyter notebook内にグラフを描く方法として
%matplotlib inline
という文を実行しておくという方法がある。
大体の場合にはこれで間に合うが、3Dグラフを回したり、アニメーションを動かしたりすることができなかった。 調べてみると他にも色々できることがわかったのでまとめる。 この記事では以下のようなプロットを描く。
- 回転できる3D
- アニメーション
- スライドバー付き
- もっと綺麗なグラフを描く
markdownで出力すると全く触れなくなったので動画を作った。
回転できる3Dプロット
%matplotlib inline
でプロットを作成すると、ノートブックの中に画像として出力されてしまうので回せない。
%matplotlib notebook
を使うとノートブックの外に出力したときと同じように、インタラクティブなグラフが描ける。 こちらの3次元プロットを例として描く。
%matplotlib notebook
from mpl_toolkits.mplot3d import Axes3D
import matplotlib.pyplot as plt
import numpy as np

x = np.arange(-3, 3, 0.25)
y = np.arange(-3, 3, 0.25)
X, Y = np.meshgrid(x, y)
Z = np.sin(X)+ np.cos(Y)

fig = plt.figure()
ax = Axes3D(fig)
ax.plot_wireframe(X,Y,Z)

plt.show()

スライドバーつき
ipywidgetsというやつを使えばできる。 jupyter notebookをインストールしただけで使おうとすると以下のコマンドを実行するように表示されたので、おとなしく従うと動くようになった。
sudo jupyter nbextension enable --py --sys-prefix widgetsnbextension
以下を実行すると、スライドバーが表示される。 このバーをいじると変数の値が動的に変わるので、コールバックにプロットを登録しておくと、スライドバーをいじるだけで勝手にプロットが変わる。
自分の環境では
%matplotlib notebook
とするとカクカクでいまいちだったが、
%matplotlib inline
にするといい感じ。
%matplotlib inline
from ipywidgets import interact
import numpy as np

def scatter(num_data):
    x = range(num_data)
    y = [np.sin(t/5.0) for t in x]
    plt.plot(x, y)
    plt.show()

interact(scatter, num_data=(1,200, 1), value=2)
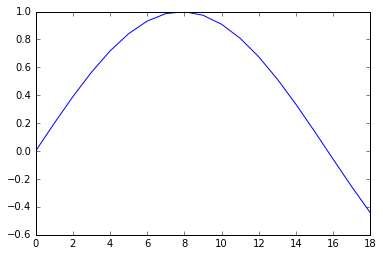
ipywidgetsには他にもボタンとかプログレスバーとか色々あって、ノートを簡単なアプリにできる。
%matplotlib inline

import pylab as plt
import time
from ipywidgets import FloatProgress
from IPython import display

prg = FloatProgress(min=0, max=99, value=1)
display.display(prg)

for i in range(100):
    prg.value = i
    time.sleep(0.01)
もっと綺麗なグラフを描く
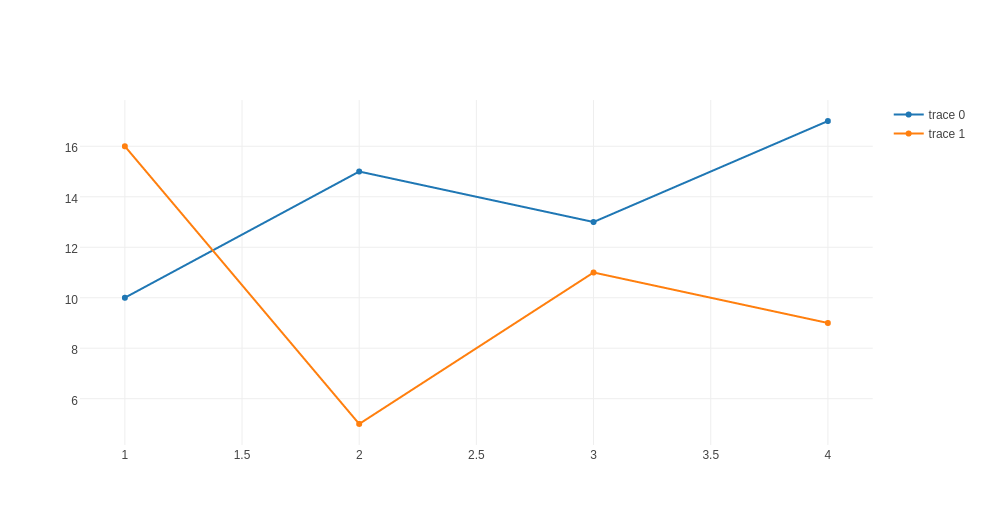
matplotlibではなくて、plotlyというライブラリを使えばできる。 matplotlibと書き方が結構違うので、改めて覚えてまでやるほどかと言われると微妙だが、グラフは綺麗でかっこいい。 コードやグラフ、データをオンラインで共有したりもできるらしい。
デモのサイトを見ていると可能性を感じる。
from plotly.offline import iplot, init_notebook_mode
import plotly.plotly as py
from plotly.graph_objs import Scatter, Data


init_notebook_mode(connected=True)

trace0 = Scatter(
    x=[1, 2, 3, 4],
    y=[10, 15, 13, 17]
)

trace1 = Scatter(
    x=[1, 2, 3, 4],
    y=[16, 5, 11, 9]
)

data = Data([trace0, trace1])
unique_url = iplot(data, filename = 'basic-line')
参考
キーボード上のいらないキーをよく使うキーに変える
はじめに
日本語配列のキーボードには変換、無変換とかカナとかほぼ使わないキーがいくつかある。 これらのキーは親指のホームポジションあたりにあるので、Altなどのよく使うキーに置き換えて有効活用することにした。
入れ替えたキーは以下
- 無変換->全角半角
- 変換->Alt
- かな->Alt
- Insert -> Delete
Xmodmap
XmodmapはXorgでキーマップを変更するためのやつ。 こちらが詳しい。
~/.Xmodmap に以下を書き込む
! 無変換->全角半角
keycode 102 = Zenkaku_Hankaku
! 変換->Alt
keycode 100 = Alt_R
! かな->alt
keycode 101 = Alt_R


! 以下はHHKBではいらない
! Insert -> Delete
! keycode 118 = Delete
!はコメント。HHKBを使っているのでInsertを入れ替える必要はなかったけど、会社では普通のキーボードを使っているので書いておく。
あとは~/.zshrcなどに
xmodmap ~/.Xmodmap
と書いておけば、ログインするたびに上の設定を読み込んでくれる。
C-nでDownしたい、が、できない。
Emacsユーザーなので、Chromeなんかを使ってるとC-nで大量のウィンドウを生成したり、C-pで印刷プレビューを開いてしまうことがよくある。
Xmodmapを使えばできるかと思ったけど、できなかった。 試したのは以下。
keycode 57 = n N Down Down
この右側2つがてっきりCtrl押した時の挙動とかそういうのかと思ったけど、どうやら違うらしい。 こちらによると、これはMode_switchというキーを押した時の挙動らしい。
さらにこちらには
"Usually the Mode_switch key is used on non-US keyboards for a few selected keys only"
とか書いてあって、なんじゃそりゃ。
左CtrlをこのMode_switchキーに割り当てることはできるけど、それをやるともはやCtrlキーでなくなってしまうので、本末転倒であった。
とりあえず、Chromeのアドオンで対応することにする。
参考
PythonをEmacsで書く+α
はじめに
この記事を書いてから早1年。 暇なときにちょこちょこといじっているうちに、helmを導入したり、tabbarを入れたりと色々変わっていた。 全部書いていると多すぎるので、中でも一番変わったpythonを書くための設定について書く。 加えて気に入っているパッケージについても書く。
全体の設定のgithubのレポジトリはこちら。 github.com elispのコードを多少書いたけど、その部分だけでなく、common.elに書いてある部分がないと動かないものもあると思う。
- 動画メインの記事を書いた
ksknw.hatenablog.com
環境
python mode
1年前はelpyとか使ってなんとかかんとかpythonを書いていた。 今思うとよく頑張って書いてたなって思う。 今はpythonを書くために主に以下のパッケージに頼っている。 これらは補完、コード規約準拠、文法チェック、テンプレート展開の機能。
- jedi
- autopep8
- pyflakes
- yasnippet
以下を使うためには、
    $ sudo apt-get install pyflakes
    $ sudo pip install jedi epc autopep8
をする必要がある。
jedi
jediはオムニ補完、つまり文法的な部分をある程度汲んだ上で補完をしてくれるパッケージ。 補完だけでなく関数の定義にジャンプする機能もある。 公式はこちら
こちらの設定を参考にして、設定した。
  (jedi:setup)
  (define-key jedi-mode-map (kbd "<C-tab>") nil) ;;C-tabはウィンドウの移動に用いる
  (setq jedi:complete-on-dot t)
  (setq ac-sources
    (delete 'ac-source-words-in-same-mode-buffers ac-sources)) ;;jediの補完候補だけでいい
  (add-to-list 'ac-sources 'ac-source-filename)
  (add-to-list 'ac-sources 'ac-source-jedi-direct)
  (define-key python-mode-map "\C-ct" 'jedi:goto-definition)
  (define-key python-mode-map "\C-cb" 'jedi:goto-definition-pop-marker)
  (define-key python-mode-map "\C-cr" 'helm-jedi-related-names)
何も考えずに設定すると、元々のauto-completeの補完も表示されてしまうので、それらは消しておくといいと思う。
こんな感じで補完される。

autopep8
コードを書くとき、演算子の両側にスペースを入れるとか、無駄な改行を入れ過ぎないとか、色々気にしてないと見た目に汚いコードになってしまう。 手で直すぐらいなら、「動くからまあいいか」となるかもしれないけど、自動で直してくれるならそれに越したことはない。 autopep8はpep8というコーディング規約と比較してダメなところを勝手に修正してくれる機能。
例えばこんな感じのコードを書いて保存すると
# -*- coding: utf-8 -*-
def test(a):


    return a+1


if __name__ == '__main__':


    print test(   10)
勝手にこのようなコードに変換されて保存される。
# -*- coding: utf-8 -*-
def test(a):

    return a + 1


if __name__ == '__main__':

    print test(10)
ちなみに、","の後ろにスペースを置くことは規約違反ではないので、 これは修正されるけど、
    test(10, 20, 30)
    test(1  ,2  ,3)
こういうのは修正されない。
    test(10, 20, 30)
    test(1,  2,  3)
ので、縦方向にインデントを揃えたいときはスペースをどこに入れるかをちょっとだけ気にしないといけない。
設定は以下。pep8の規定に1行79字以内というのがあるが、さすがに厳しすぎないかと思うので、200字に変えてある。
(require 'py-autopep8)
(setq py-autopep8-options '("--max-line-length=200"))
(setq flycheck-flake8-maximum-line-length 200)
(py-autopep8-enable-on-save)
pyflakes (flymake-cursor)
pythonはコンパイルが不要なので、逆にエラーがあったとしても、その箇所が実行されるまでわからない。 pyflakesはとても便利で、エラーやwarningを表示してくれる。 これをEmacsから呼ぶことで、画面内にエラーなどを表示できる。
    (flymake-mode t)
    ;;errorやwarningを表示する
    (require 'flymake-python-pyflakes)
    (flymake-python-pyflakes-load)

こんな感じでpyflakesを勝手に実行して結果を表示してくれる。
yasnippet
他のエディタになかなか移れない原因の一端がこの機能。 短いフレーズを入力した後、tabを押すと予め登録されたフレーズを挿入してくれる。 githubのレポジトリはこちら。 単純なフレーズの挿入だけでなく、
class $0:
    def __init__(self, $1)
        $2
とか書いておくと、$のところを順番にカーソル移動させて穴埋めみたいな感じでコードを書くこともできる。
以下のようなものがたくさん登録してある。
. + Tab
self.np + Tab
import numpy as npifmain + Tab
if __name__ == '__main__':
気に入っているパッケージ
helm
1年前はanythingを使っていた。 anything-filelist+には大変お世話になったんだけど、helmにはhelm-locateというものがあって(anythingにもあるのかもしれないが)、そっちのほうが便利そうだったので、helmに乗り換えた。 helm-locateはデフォルトではand検索ができなくて不便だったけれど、こちらの設定を使うと、and検索できるようになって、all.filelistとかも作らなくていいしfilelist+いらないなってなった。
全般的な設定はこちらを参考にした 。
locateはファイルを作った直後なんかは更新されていないので、 $ sudo updatedb とかやる必要がたまにある。
見た目
本質的ではないけど、なんやかんやこれをいじるのが一番楽しいかもしれない。
最近追加したもののなかでTabbarがいい感じだった。 ファイル開くときはだいたいhelm使ってるから別にいらないっちゃいらないけど。
;;tabバーを追加する。
; tabbar.el http://cloverrose.hateblo.jp/entry/2013/04/15/183839
(require 'tabbar)
(tabbar-mode 1)
;; グループ化しない
(setq tabbar-buffer-groups-function nil)
;;画像はいらない
(setq tabbar-use-images nil)
;; 左に表示されるボタンを無効化
(dolist (btn '(tabbar-buffer-home-button
               tabbar-scroll-left-button
               tabbar-scroll-right-button))
  (set btn (cons (cons "" nil)
                 (cons "" nil))))
;; タブ同士の間隔
;; http://ser1zw.hatenablog.com/entry/2012/12/31/022359

(setq tabbar-separator '(0.8))

(defun my-tabbar-buffer-list ()
  (delq nil
        (mapcar #'(lambda (b)
                    (cond
                     ;; Always include the current buffer.
                     ((eq (current-buffer) b) b)
                     ((buffer-file-name b) b)
                     ((char-equal ?\  (aref (buffer-name b) 0)) nil)
;;          ((equal "*scratch*" (buffer-name b)) b) ; *scratch*バッファは表示する
             ((equal "*eww*" (buffer-name b)) b) ; *eww*バッファは表示する
             ((char-equal ?* (aref (buffer-name b) 0)) nil) ; それ以外の * で始まるバッファは表示しない
                     ((buffer-live-p b) b)))
                (buffer-list))))
(setq tabbar-buffer-list-function 'my-tabbar-buffer-list)

;; tabbar外観変更
(set-face-attribute
 'tabbar-default nil
 :family (face-attribute 'default :family)
 :background (face-attribute 'mode-line-inactive :background)
 :height 1.0)
(set-face-attribute
 'tabbar-unselected nil
 :background (face-attribute 'mode-line-inactive :background)
 :foreground (face-attribute 'mode-line-inactive :foreground)
 :box nil)
(set-face-attribute
 'tabbar-selected nil
 :background (face-attribute 'mode-line :background)
 :foreground (face-attribute 'mode-line :foreground)
 :box nil)
その他細々と設定して、こんな感じの見た目になる。

Emacsを再起動したときに、終了時の状態に戻す
Emacsを起動して、画面を分割して、昨日開いていたファイルを開いてってやるのめんどくさい。 こちらを参考にして、desktop-save-modeを設定した。 以下は設定後に自動的にinit.elに追加されていた。
;;再起動時に色々復元
(custom-set-variables
 ;; custom-set-variables was added by Custom.
 ;; If you edit it by hand, you could mess it up, so be careful.
 ;; Your init file should contain only one such instance.
 ;; If there is more than one, they won't work right.
 '(desktop-save-mode t))
(custom-set-faces
 ;; custom-set-faces was added by Custom.
 ;; If you edit it by hand, you could mess it up, so be careful.
 ;; Your init file should contain only one such instance.
 ;; If there is more than one, they won't work right.
 )
今後やろうと思ってる設定
参考
- GitHub - tkf/emacs-jedi: Python auto-completion for Emacs
- Jedi.el: jump to definition **and back again**
- pyflakes 1.4.0 : Python Package Index
- GitHub - joaotavora/yasnippet: A template system for Emacs
- NTEmacs @ ウィキ - helm を使うための設定
- Helm をストレスなく使うための個人的な設定 - あらびき日記
- tabbar.elでEmacsをタブエディタ化 (自動で最適な設定をしたい) - cloverrose's blog
- 年末なのでEmacsの設定ファイルを見直しますよ - ser1zw's blog
- Emacsの終了時の状態を保存する
FaxOCR手書き数字データの認識 その2
%matplotlib inline
import pylab as plt
import pandas as pd
import numpy as np
概要
前回、FaxOCRという手書き数字のデータの認識をやった。 認識自体はぼちぼちできたが、MNISTデータで学習させたCNNで認識を行うといまいちだったのが気になった。 バグやミスの可能性を潰してもう一度やってみたけど、同様にうまくいかなかった。 データを見ていると文字のサイズが異なっていることに気づいた。 サイズを統一してやってみると、MNISTデータで学習させたCNNである程度正しく予測することができた。
はじめに
前回、FaxOCRという手書き数字のデータの認識をやった。 学習データを回転させるなどしてデータを増やして、CNNを使って学習させると、96%ぐらいの精度で予測することができた。 一方で、MNISTのデータを使って学習させたCNNでは70%弱でしか当てることができなかった。 自分のプログラムや計算にミスがある可能性も考えながら、色々やる。 今回はMNISTデータとの違いを見ることが目的なので、FaxOCRのデータは全て前処理されていない元画像データ(numbers-sample, mustread)を使った。 FaxOCRについてはこちら。
ミスの可能性をなくす
全部画像データに変換する
前回はMNISTのデータをバイナリで読み込んでCNNやt-SNEに突っ込んでいた。やらかしているならここだなと思って、とりあえず全部pngにした。
import pylab as plt
from sklearn.datasets import fetch_mldata
import numpy as np


def save(image, name):
    fig = plt.figure()
    ax = fig.add_subplot(1, 1, 1)
    imgplot = ax.imshow(image, cmap=plt.cm.Greys)
    imgplot.set_interpolation('nearest')
    ax.xaxis.set_ticks_position('top')
    ax.yaxis.set_ticks_position('left')
    plt.imsave(name)
    # plt.savefig(name) # savefigだとグラフの軸も描画される

mnist = fetch_mldata('MNIST original', data_home=".")
y = mnist.target
X = - mnist.data.reshape(len(y), 28, 28) + 255

counter = np.zeros(10)
from itertools import izip
for image, label in izip(X, y):
    label = int(label)
    plt.imsave("%d_%d.png" % (label, counter[label]), image, cmap=plt.cm.gray)
    counter[label] += 1
プレビューが死ぬほど重いけど、特に問題なさそう。
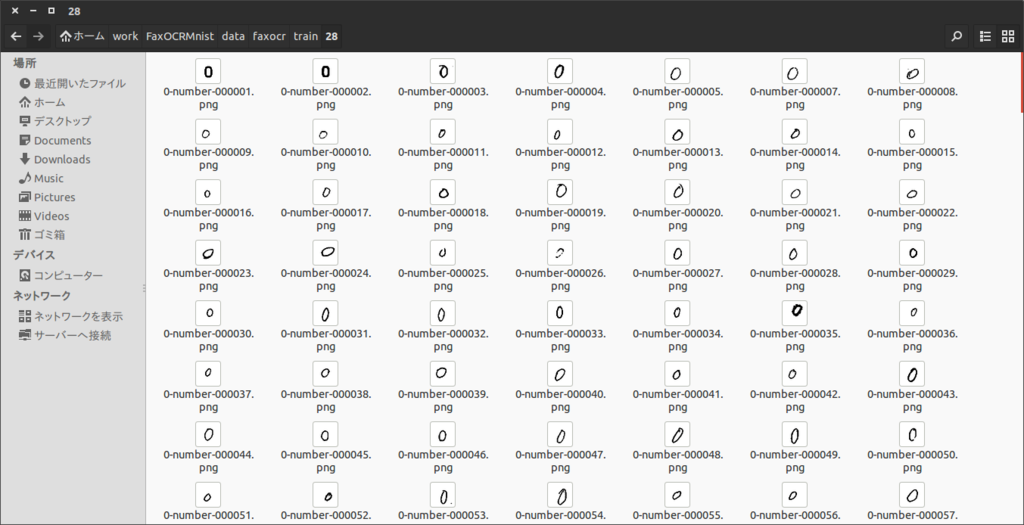
FaxOCR
MNIST
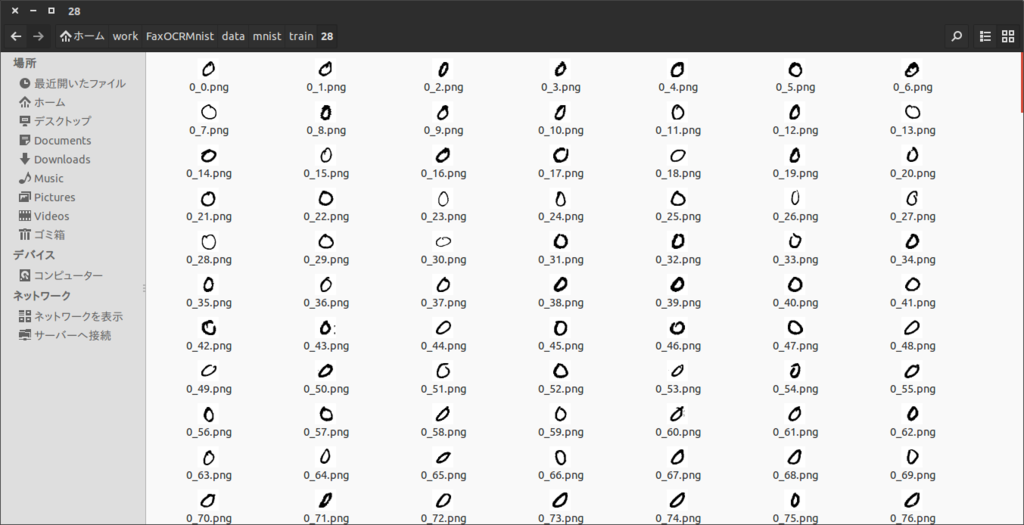
FaxOCRのデータは以下のようにImageMagicを使って、28x28に変えた。
for i in *
do
convert -resize 28x28! $i ../28/$i
done
CNNのコードを書き直す
ネットにあったコードを行き当りばったりな感じで編集してコードを書いていた。 コメントアウトで条件変えたり、ミスしてそうなところがあったので、そこそこちゃんと書き直す。(書きなおしたあと色々あってまた行き当りばったり的なコードになっているけど気にしない)
learn.py
# -*- coding: utf-8 -*-
import numpy as np
import glob
import cv2 as cv
from itertools import izip
import random

from cnn import cnn


def read_imgs(dirname, labelpos=1):
    imgs = []
    labels = []
    for img_file in glob.glob(dirname + "/*.png"):
        imgs.append((255 - cv.imread(img_file, flags=0)) / 255.0)
        labels.append(int(img_file[len(dirname) + labelpos]))
    return np.array(imgs), np.array(labels)


def learn(train="faxocr", imsize="28"):
    X_test, y_test = read_imgs("./data/faxocr/test/%s" % imsize)

    # if train == "mnist":
    #     assert(int(imsize) == 28)
    X_train, y_train = read_imgs("./data/%s/train/%s" % (train, imsize))

    size = tuple(np.array([X_train[0].shape[1], X_train[0].shape[0]]))

    if train == "faxocr":
        new_imgs = []
        new_labels = []
        for img, label in izip(X_train, y_train):
            for i in range(20):
                rad = (random.random() - 0.5) * 0.5
                pos1 = (random.random() - 0.5) * 5
                pos2 = (random.random() - 0.5) * 5
                mat = np.float32([[np.cos(rad), -1 * np.sin(rad), pos1],
                                  [np.sin(rad), np.cos(rad), pos2]])
                dst = cv.warpAffine(img, mat, size, flags=cv.INTER_LINEAR)
                new_imgs.append(dst)
                new_labels.append(label)
        X_train = np.r_[X_train, new_imgs]
        y_train = np.r_[y_train, new_labels]
    cnn(X_train, y_train,
        X_test,  y_test,
        #        "./results/" + train + "_%s_" % imsize, size=imsize)
        "./results/" + train + "_%s_" % imsize, size=28)

if __name__ == '__main__':
    learn(train="mnist", imsize="trim_28")
cnn.py
# coding: utf-8
import numpy as np
import chainer
from chainer import cuda
import chainer.functions as F
from chainer import optimizers
import time


def cnn(train_data, train_label,
        test_data,  test_label,
        resultname_header,
        n_epoch=50, batchsize=100,
        size=28):

    cuda.check_cuda_available()
    xp = cuda.cupy

    N = train_label.size
    N_test = test_label.size

    train_data = train_data.reshape(len(train_label), -1)
    train_data = train_data.astype(xp.float32)
    train_label = train_label.astype(xp.int32)
    test_data = test_data.reshape(len(test_label), -1)
    test_data = test_data.astype(xp.float32)
    test_label = test_label.astype(xp.int32)

    train_data = train_data.reshape((len(train_data), 1, size, size))
    test_data = test_data.reshape((len(test_data), 1, size, size))

    print test_data.shape
    print train_data.shape

    print test_data.mean()
    print train_data.mean()

    if size == 28:
        model = chainer.FunctionSet(conv1=F.Convolution2D(1, 20, 5),
                                    conv2=F.Convolution2D(20, 50, 5),
                                    l1=F.Linear(800, 500),
                                    l2=F.Linear(500, 10))

    else:
        model = chainer.FunctionSet(conv1=F.Convolution2D(1, 20, 3),
                                    conv2=F.Convolution2D(20, 50, 3),
                                    l1=F.Linear(6050, 800),
                                    l2=F.Linear(800, 10))

    cuda.get_device(0).use()
    model.to_gpu()

    def forward(x_data, y_data, train=True):
        x, t = chainer.Variable(x_data), chainer.Variable(y_data)
        h = F.max_pooling_2d(F.relu(model.conv1(x)), 2)
        h = F.max_pooling_2d(F.relu(model.conv2(h)), 2)
        h = F.dropout(F.relu(model.l1(h)), train=train)
        y = model.l2(h)
        if train:
            return F.softmax_cross_entropy(y, t)
        else:
            return F.accuracy(y, t)

    optimizer = optimizers.Adam()
    # optimizer = optimizers.RMSprop()
    optimizer.setup(model)

    fp1 = open(resultname_header + "accuracy_row.txt", "w")
    fp2 = open(resultname_header + "loss_row.txt", "w")

    fp1.write("epoch\ttest_accuracy\n")
    fp2.write("epoch\ttrain_loss\n")


    start_time = time.clock()
    for epoch in range(1, n_epoch + 1):
        print "epoch: %d" % epoch

        perm = np.random.permutation(N)
        sum_loss = 0
        for i in range(0, N, batchsize):
            x_batch = xp.asarray(train_data[perm[i:i + batchsize]])
            y_batch = xp.asarray(train_label[perm[i:i + batchsize]])

            optimizer.zero_grads()
            loss = forward(x_batch, y_batch)
            loss.backward()
            optimizer.update()
            sum_loss += float(loss.data) * len(y_batch)

        print "train mean loss: %f" % (sum_loss / N)
        fp2.write("%d\t%f\n" % (epoch, sum_loss / N))
        fp2.flush()

        sum_accuracy = 0
        for i in range(0, N_test, batchsize):
            x_batch = xp.asarray(test_data[i:i + batchsize])
            y_batch = xp.asarray(test_label[i:i + batchsize])

            acc = forward(x_batch, y_batch, train=False)
            sum_accuracy += float(acc.data) * len(y_batch)

        print "test accuracy: %f" % (sum_accuracy / N_test)
        fp1.write("%d\t%f\n" % (epoch, sum_accuracy / N_test))
        fp1.flush()

    end_time = time.clock()
    print end_time - start_time

    fp1.close()
    fp2.close()

    import cPickle
    model.to_cpu()
    cPickle.dump(model, open(resultname_header + "model_cnn_row.pkl", "wb"), -1)
学習結果
ミスしそうなところはだいたい直したので、もう一度CNNを使って学習させてみた。以下は結果。
FaxOCR -> FaxOCR (28x28)
accuracy = pd.read_csv("./results/faxocr_28_accuracy_row.txt", sep="\t")
loss = pd.read_csv("./results/faxocr_28_loss_row.txt", sep="\t")

fig = plt.figure(figsize=[10,10])
accuracy["test_accuracy"].plot()
plt.ylim([0,1])
loss["train_loss"].plot()
plt.title("FaxOCR->FaxOCR")
plt.show()
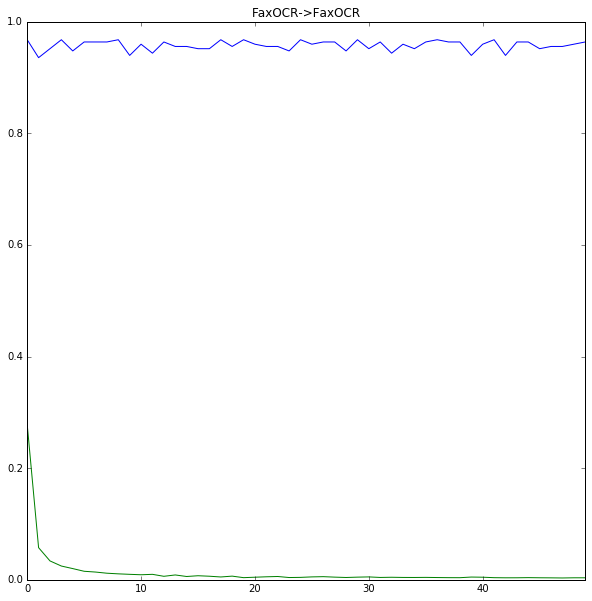
これは前回と同様な感じ。だいたいOK。
MNIST -> FaxOCR (28x28)
accuracy = pd.read_csv("./results/mnist_28_accuracy_row.txt", sep="\t")
loss = pd.read_csv("./results/mnist_28_loss_row.txt", sep="\t")

fig = plt.figure(figsize=[10,10])
accuracy["test_accuracy"].plot()
plt.ylim([0,1])
loss["train_loss"].plot()
plt.title("MNIST->FaxOCR")
plt.show()

残念ながらこれも前回と同じ。どうもミスとかではなく、普通にダメそう。 loss自体は下がっているので、MNISTとFaxOCRのデータが何かしら違うことが原因っぽい。
データをみる
個々のデータを目で見ていても、特に不自然なところはないように感じたので、色々絵を描いてみて考えることにした。
from learn import read_imgs

mnist_data,  mnist_label  = read_imgs("./data/mnist/train/28")
faxocr_data, faxocr_label = read_imgs("./data/faxocr/train/28")

print mnist_data.mean()
print faxocr_data.mean()
0.131017957897
0.079225616316
画素の平均値が違っているのが少し気になる。
t-SNE
まずは僕の大好きなt-SNEで絵を描く。 前回はMNISTを1000個とFaxOCRのテストデータを使って可視化したけど、今回はMNISTデータ7000個とFaxOCRの学習データ6709個を使った。
num_mnist = 7000

import random
indecies = random.sample(range(len(mnist_data)), num_mnist)

data = np.r_[mnist_data[indecies].reshape(num_mnist, -1), faxocr_data.reshape(len(faxocr_data),-1)]

from sklearn.manifold import TSNE
model = TSNE(n_components=2)
tsned = model.fit_transform(data)
label = np.r_[["b" for i in range(num_mnist)], ["r" for i in range(len(faxocr_data))]]
plt.figure(figsize=(30,30))
plt.scatter(tsned[:,0], tsned[:,1], c=label, linewidths=0)
plt.show()
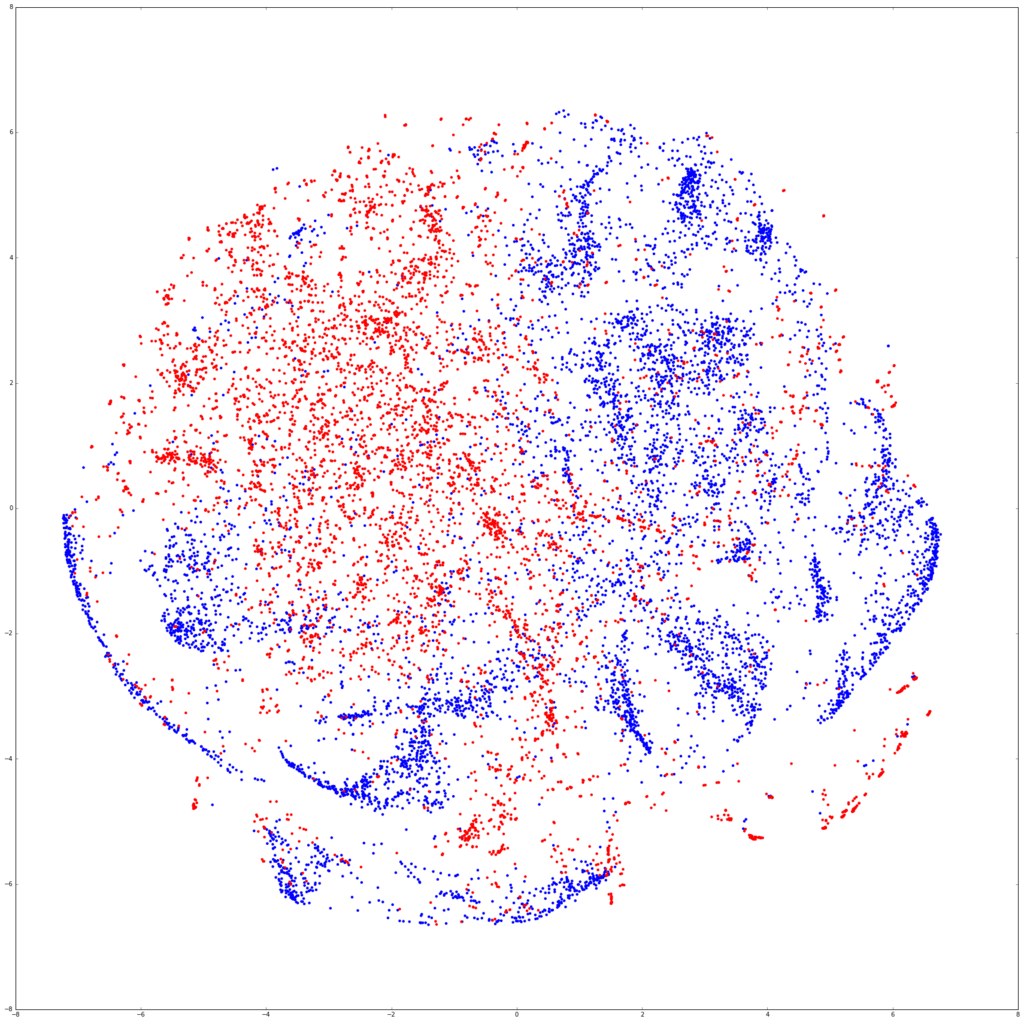
青がMNIST、赤がFaxOCR。分離してるなぁーって感じの図。わかりにくいので、数字ごとに図を描いてみる。
fig = plt.figure(figsize=(30,40))
for num in range(10):
    fig.add_subplot(4,3,num+1)
    label = np.r_[["b" if i==num else "w" for i in mnist_label[indecies]], ["r" if i==num else "w" for i in faxocr_label]]
    plt.scatter(tsned[:,0], tsned[:,1], c=label, linewidths=0, alpha=0.6, marker=".")
    plt.title(str(num))
plt.show()
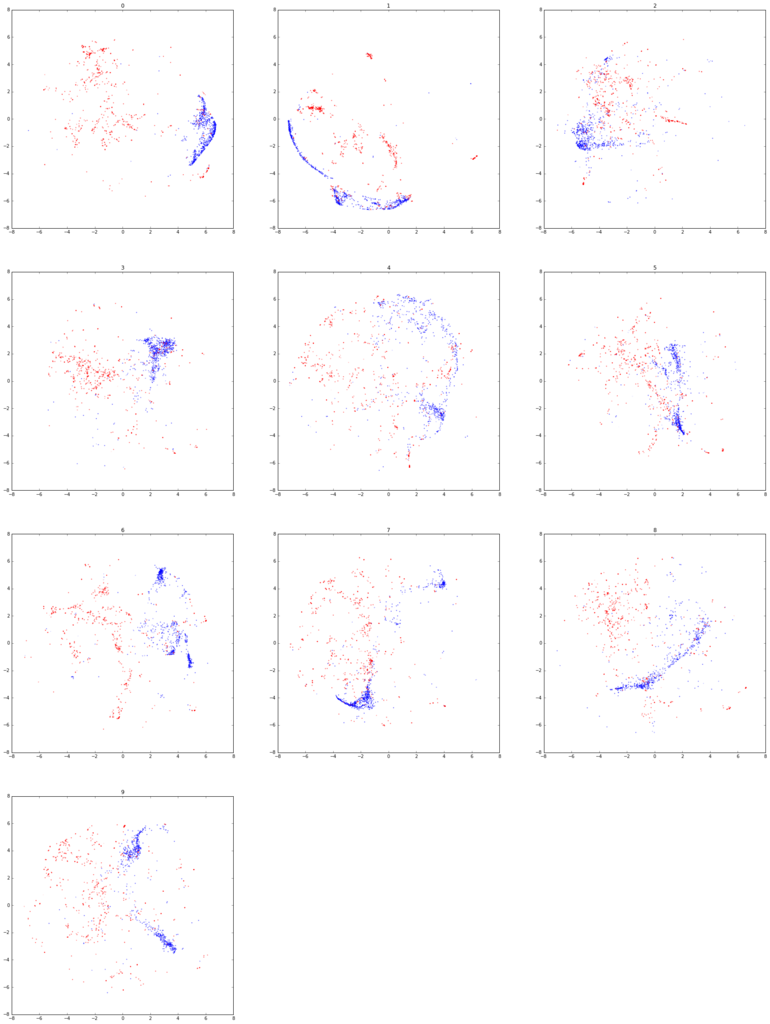
まあだめでしょうねって感じの図になった。
ちょっと気になったので、FaxOCRデータとMNISTデータそれぞれでt-SNEして図を描いてみる。
model_faxocr = TSNE(n_components=2)
tsned_faxocr = model_faxocr.fit_transform(faxocr_data.reshape(len(faxocr_data),-1))
model_mnist = TSNE(n_components=2)
tsned_mnist = model_faxocr.fit_transform(mnist_data[indecies].reshape(num_mnist,-1))

plt.figure(figsize=(20,10))
plt.subplot(121)
plt.title("FaxOCR")
plt.scatter(tsned_faxocr[:,0], tsned_faxocr[:,1], c=faxocr_label, linewidths=0, marker=".")
plt.subplot(122)
plt.title("MNIST")
plt.scatter(tsned_mnist[:,0], tsned_mnist[:,1], c=mnist_label[indecies], linewidths=0, marker=".")
plt.show()
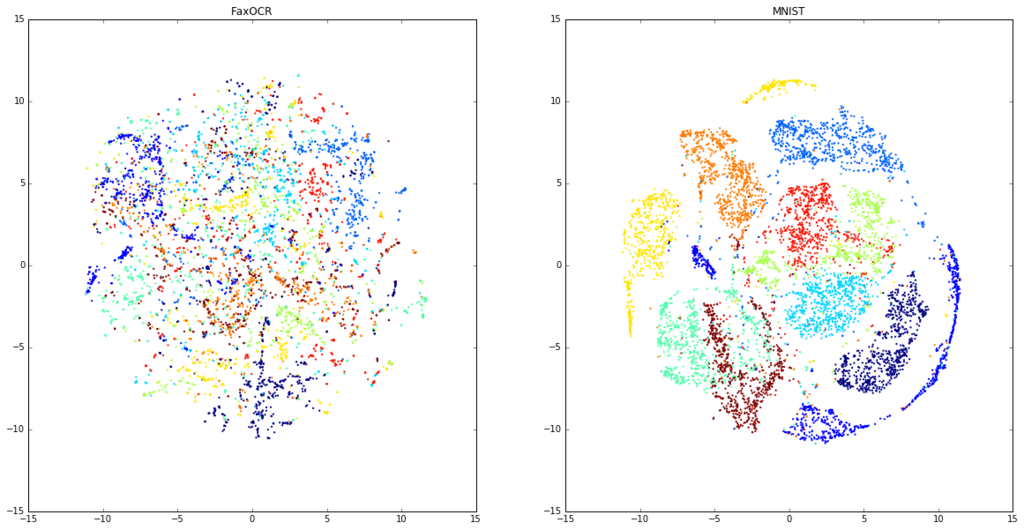
なんだこれは。MNISTの方はすごいきれいに分かれているのに。
ちなみに回転させたデータを入れたFaxOCRのデータを可視化すると以下。
new_imgs = []
new_labels = []
size = tuple(np.array([faxocr_data[0].shape[1], faxocr_data[0].shape[0]]))

from itertools import izip
import cv2 as cv
for img, label in izip(faxocr_data, faxocr_label):
    for i in range(20):
        rad = (random.random() - 0.5) * 0.5
        pos1 = (random.random() - 0.5) * 5
        pos2 = (random.random() - 0.5) * 5
        mat = np.float32([[np.cos(rad), -1 * np.sin(rad), pos1],
                          [np.sin(rad), np.cos(rad), pos2]])
        dst = cv.warpAffine(img, mat, size, flags=cv.INTER_LINEAR)
        new_imgs.append(dst)
        new_labels.append(label)
many_data = np.r_[faxocr_data, new_imgs]
many_label = np.r_[faxocr_label, new_labels]

fax_indecies = random.sample(range(len(many_data)), num_mnist)

model_many = TSNE(n_components=2)
tsned_many = model_many.fit_transform(many_data.reshape(len(many_data),-1)[fax_indecies])

plt.figure(figsize=(10,10))
plt.scatter(tsned_many[:,0], tsned_many[:,1], c=many_label[fax_indecies], linewidths=0, marker=".")
plt.show()
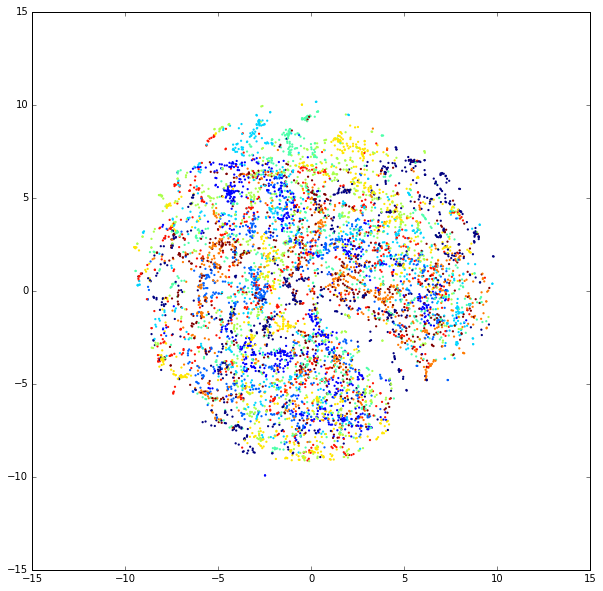
このデータ分離できるというのはCNNがすごいのかt-SNEがいまいちなのかなんなんだ。 というかMNISTのデータはなんであんなに綺麗に描けるんだ。
どの点がどの画像なのかを見る。
数字ごとに分けて書いた図を見ているとどうもMNISTとFaxOCRで被っている点もある。その点がどの点なのかを見ることで、何かわかるんじゃないかと思って、以下のように可視化した。
MNISTとFaxOCRの点が重なっているところで緑とかになっているのは、直すのがめんどうなだけなので気にしないでほしい。(これ系の図のもっと楽な書き方を知っている人がいたら教えて欲しいです…)
img_size = 28 * 100
label = np.r_[mnist_label[indecies].reshape(num_mnist, -1), faxocr_label.reshape(len(faxocr_data),-1)]
positions = (tsned - tsned.min()) *img_size/(tsned.max() - tsned.min())
plt.figure(figsize=(50*2,50*5))
for num in range(10):
    plt.subplot(5,2,num+1)
    img = np.ones((img_size, img_size, 3))
    for i, pos in enumerate(positions):
        if label[i] != num:
            continue
        temp = data[i].reshape(28,28)
        if i < num_mnist:
            temp = np.c_[ np.zeros([784]), data[i], data[i]]
        else:
            temp = np.c_[data[i], data[i],  np.zeros([784])]
        temp = temp.reshape(28,28,3)


        if pos[0]-14<0 or pos[0]+14>img_size or pos[1]-14<0 or pos[1]+14>img_size:
            continue
        img[pos[0]-14:pos[0]+14, pos[1]-14:pos[1]+14, :] -= temp

    plt.imshow(img)
    plt.title(num)
    #plt.savefig("./results/tsne%d.png"%num)
    #plt.savefig("./results/tsne%d.eps"%num)
plt.show()
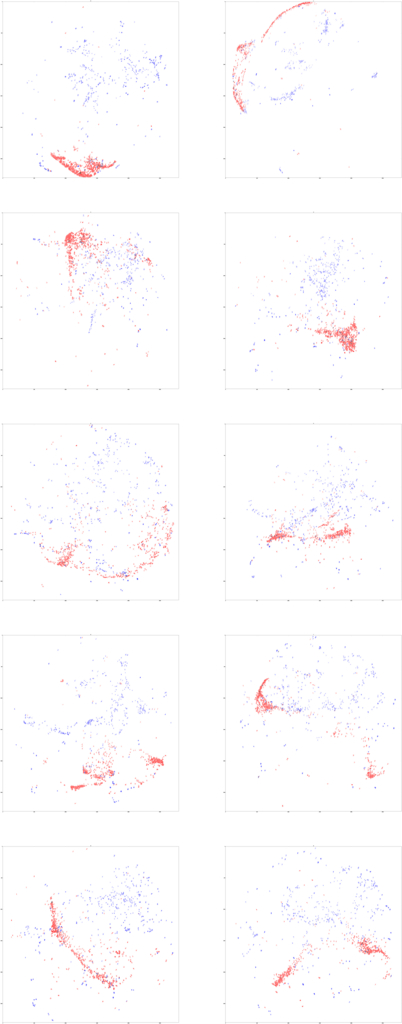
図をぼんやり眺めていると、「これ字のサイズが違うだけじゃね」って思い始めた。 (図が縮小されてわからないと思うので、こちらに元サイズの画像をおいた。ちなみに5492x13993ある。)
画像中の文字の大きさを統一する
FaxOCRのデータは元データをそのまま入力しているので、大きさが統一されていない。MNISTのデータも色々な大きさの数字が混ざっているんだろうと思い込んでいたんだけど、どうもそうでもないみたい。 ちゃんと公式サイトみると、
"The digits have been size-normalized and centered in a fixed-size image."
って書いてあった。
というわけで同様の処理をFaxOCRのデータにも行う。 トリミングして数字を画像の中心にもってきてってやるの、ちゃんとプログラム書くとそこそこめんどうだなぁと思っていたけど、 ImageMagickで探してみたら意外とあったので、以下のようにコマンドを叩いてぱぱっとやる。 こちらとこちらを参考にした。
for i in *
do
convert -fuzz %60 -trim $i ../trim/$i
done
cd ../trim
for i in *
do
convert $i -background white -gravity center -thumbnail 28x28 -extent 28x28 ../trim_28/$i
done
余白の設定がめんどうだったので、FaxOCRだけでなくMNISTのデータにも適応した。
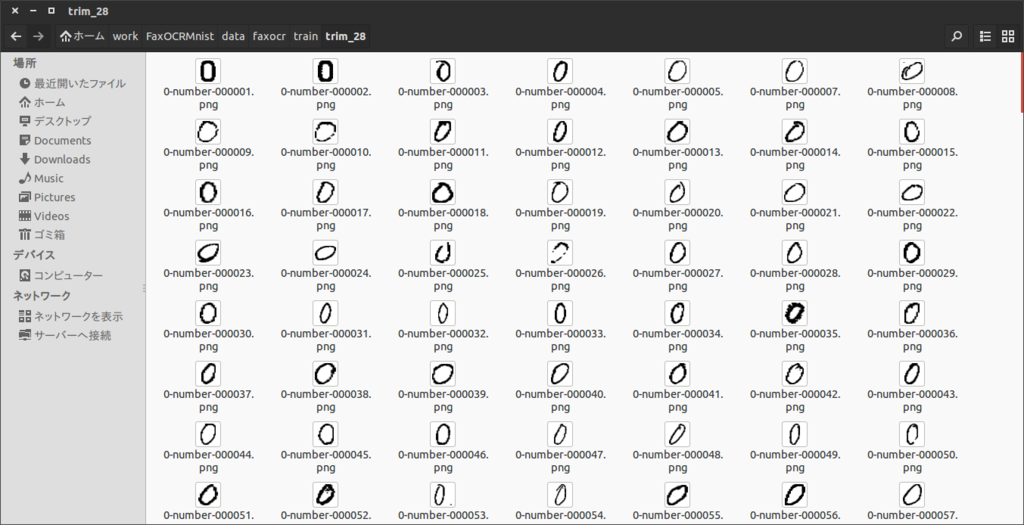
できた画像は以下のような感じ
再びt-SNE
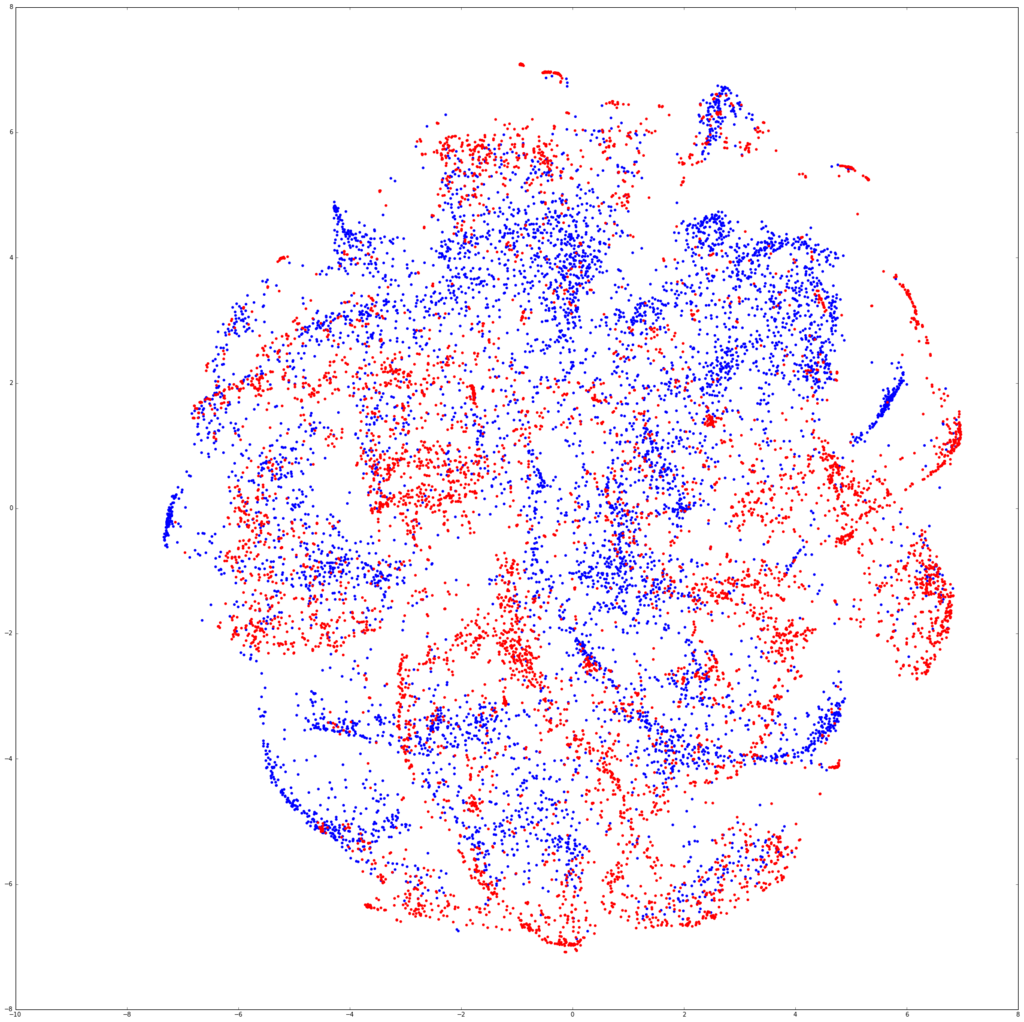
サイズを調整した画像を再びt-SNEに突っ込んで可視化する。
from learn import read_imgs

mnist_data,  mnist_label  = read_imgs("./data/mnist/train/trim_28")
faxocr_data, faxocr_label = read_imgs("./data/faxocr/train/trim_28")

print mnist_data.mean()
print faxocr_data.mean()
num_mnist = 7000

import random
indecies = random.sample(range(len(mnist_data)), num_mnist)

data = np.r_[mnist_data[indecies].reshape(num_mnist, -1), faxocr_data.reshape(len(faxocr_data),-1)]
0.298007055179
0.206816194953
from sklearn.manifold import TSNE
model = TSNE(n_components=2)
tsned = model.fit_transform(data)
label = np.r_[["b" for i in range(num_mnist)], ["r" for i in faxocr_data]]
plt.figure(figsize=(30,30))
plt.scatter(tsned[:,0], tsned[:,1], c=label, linewidths=0)
plt.show()
img_size = 28 * 100
label = np.r_[mnist_label[indecies].reshape(num_mnist, -1), faxocr_label.reshape(len(faxocr_data),-1)]
positions = (tsned - tsned.min()) *img_size/(tsned.max() - tsned.min())
plt.figure(figsize=(50*2,50*5))
for num in range(10):
    plt.subplot(5,2,num+1)
    img = np.ones((img_size, img_size, 3))
    for i, pos in enumerate(positions):
        if label[i] != num:
            continue
        temp = data[i].reshape(28,28)
        if i < num_mnist:
            temp = np.c_[ np.zeros([784]), data[i], data[i]]
        else:
            temp = np.c_[data[i], data[i],  np.zeros([784])]
        temp = temp.reshape(28,28,3)


        if pos[0]-14<0 or pos[0]+14>img_size or pos[1]-14<0 or pos[1]+14>img_size:
            continue
        img[pos[0]-14:pos[0]+14, pos[1]-14:pos[1]+14, :] -= temp

    plt.imshow(img)
    plt.title(num)
    #plt.savefig("./results/tsne%d.png"%num)
    #plt.savefig("./results/tsne%d.eps"%num)
plt.show()
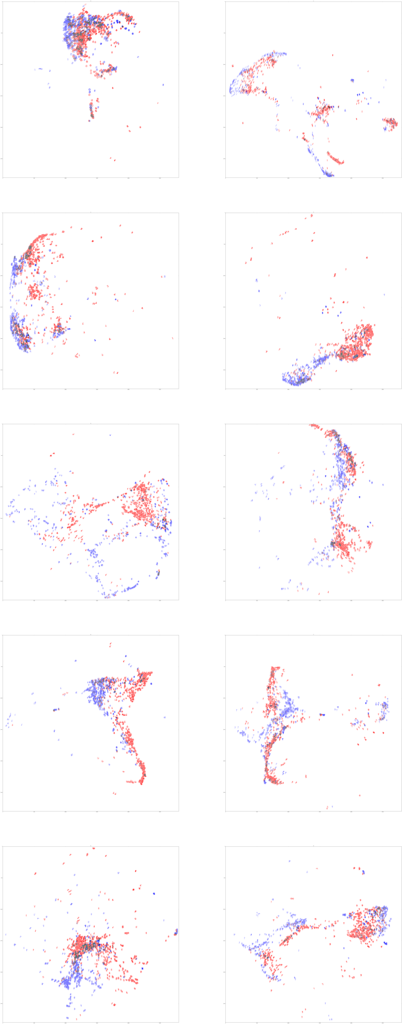
model_faxocr = TSNE(n_components=2)
tsned_faxocr = model_faxocr.fit_transform(faxocr_data.reshape(len(faxocr_data),-1))

plt.figure(figsize=(30,30))
plt.scatter(tsned_faxocr[:,0], tsned_faxocr[:,1], c=faxocr_label, linewidths=0)
plt.show()
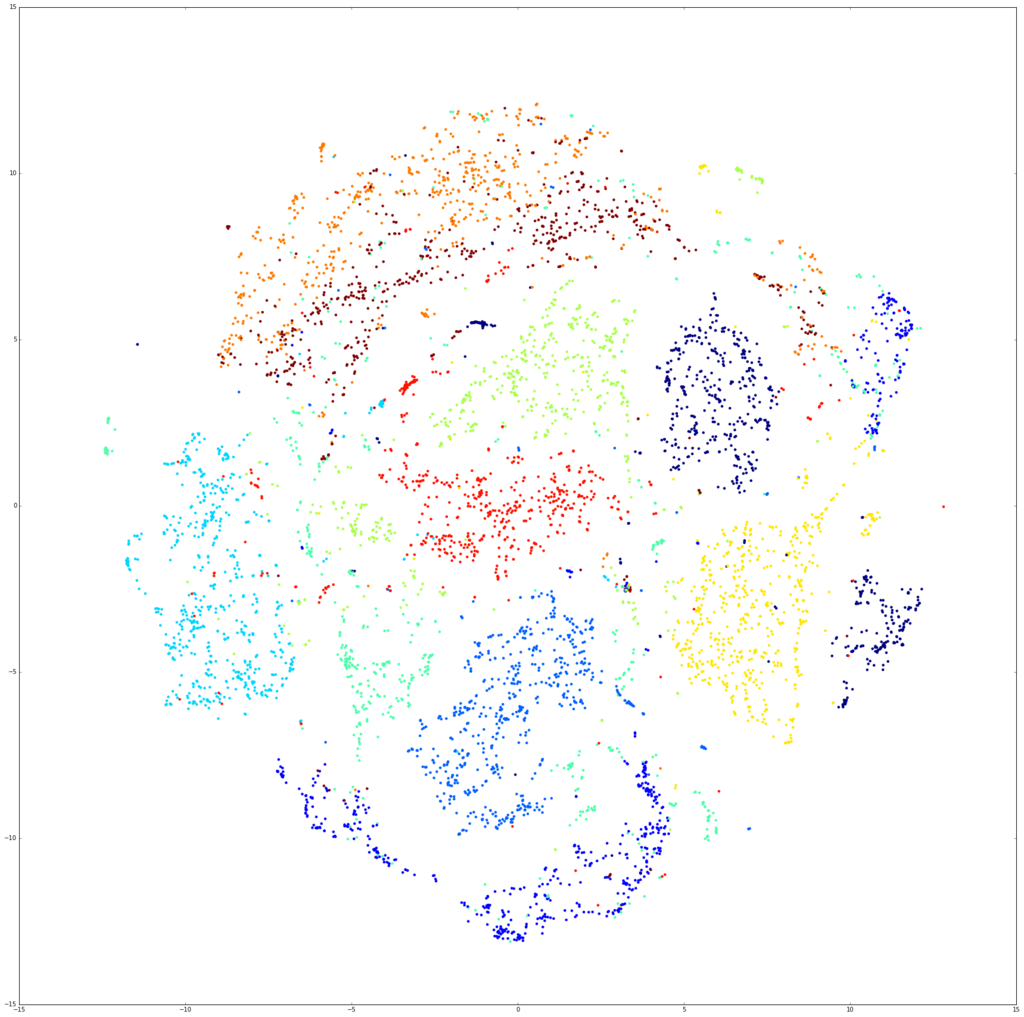
あ、これいけるわ。
再びCNN
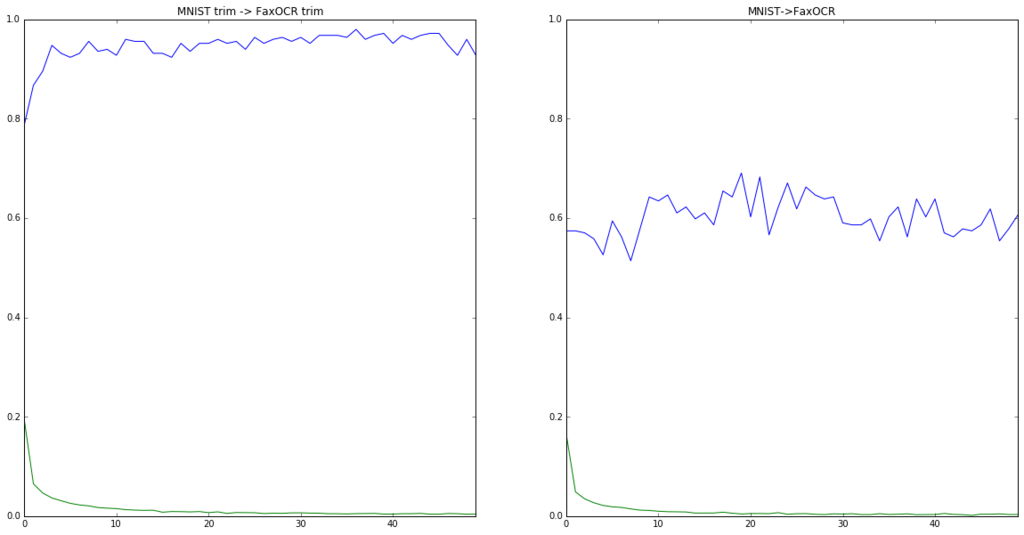
いけそうなのでCNNに突っ込んだ。結果は以下。
fig = plt.figure(figsize=[20,10])
plt.subplot(121)
accuracy = pd.read_csv("./results/mnist_trim_28_accuracy_row.txt", sep="\t")
loss = pd.read_csv("./results/mnist_trim_28_loss_row.txt", sep="\t")
print accuracy
accuracy["test_accuracy"].plot()
plt.ylim([0,1])
loss["train_loss"].plot()
plt.title("MNIST trim -> FaxOCR trim")
plt.subplot(122)
accuracy = pd.read_csv("./results/mnist_28_accuracy_row.txt", sep="\t")
loss = pd.read_csv("./results/mnist_28_loss_row.txt", sep="\t")
accuracy["test_accuracy"].plot()
plt.ylim([0,1])
loss["train_loss"].plot()
plt.title("MNIST->FaxOCR")
plt.show()
        epoch  test_accuracy
    0       1       0.787149
    1       2       0.867470
    2       3       0.895582
    3       4       0.947791
    4       5       0.931727
    5       6       0.923695
    6       7       0.931727
    7       8       0.955823
    8       9       0.935743
    9      10       0.939759
    10     11       0.927711
    11     12       0.959839
    12     13       0.955823
    13     14       0.955823
    14     15       0.931727
    15     16       0.931727
    16     17       0.923695
    17     18       0.951807
    18     19       0.935743
    19     20       0.951807
    20     21       0.951807
    21     22       0.959839
    22     23       0.951807
    23     24       0.955823
    24     25       0.939759
    25     26       0.963855
    26     27       0.951807
    27     28       0.959839
    28     29       0.963855
    29     30       0.955823
    30     31       0.963855
    31     32       0.951807
    32     33       0.967871
    33     34       0.967871
    34     35       0.967871
    35     36       0.963855
    36     37       0.979920
    37     38       0.959839
    38     39       0.967871
    39     40       0.971888
    40     41       0.951807
    41     42       0.967871
    42     43       0.959839
    43     44       0.967871
    44     45       0.971888
    45     46       0.971888
    46     47       0.947791
    47     48       0.927711
    48     49       0.959839
    49     50       0.927711
MNISTだけで学習したCNNを使って、無事90%を超えるぐらいの精度は出すことができた。
右は最初にやった正規化していないデータ。
おわりに
normalize大事という意識は今までもあったつもりだったけど、正直ここまでとは思ってなかった。 今回は特にnormalizeされたデータであるMNISTのデータを使って、normalizeされてないFaxOCRのデータを認識しようとしていたのが良くなかった。実際にFaxOCRのデータでFaxOCRのデータを予測すると、それなりに上手くいっていた。CNNがきちんと学習してくれていたんだと思う。
一方でt-SNEを、正規化していないFaxOCRのデータに対して適用すると、かなりまずいことになっていた。今までなんとなくt-SNEに突っ込んで学習できそうかどうか見るというのをよくやっていたけど、もう少し気をつけたほうが良さそう。まずはt-SNEの論文をちゃんと読もうと思った。
おまけ
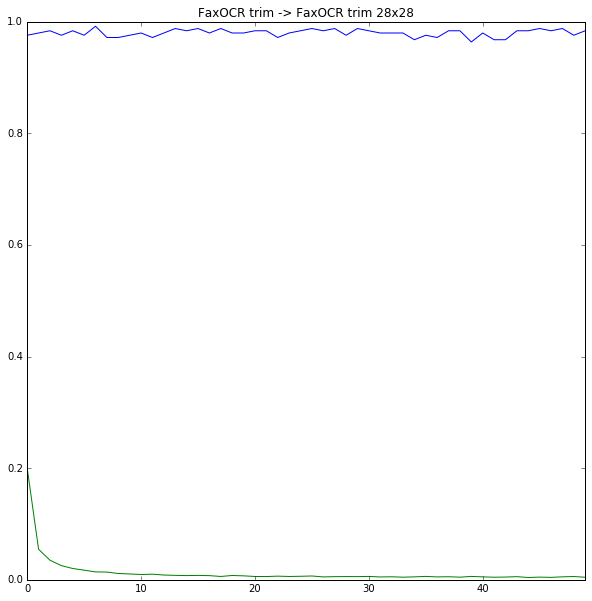
正規化したFaxOCRのデータを使って正規化したFaxOCRのデータを当てにいった。結果は以下。
28x28
fig = plt.figure(figsize=[10,10])
accuracy = pd.read_csv("./results/faxocr_trim_28_accuracy_row.txt", sep="\t")
loss = pd.read_csv("./results/faxocr_trim_28_loss_row.txt", sep="\t")
print accuracy
accuracy["test_accuracy"].plot()
plt.ylim([0,1])
loss["train_loss"].plot()
plt.title("FaxOCR trim -> FaxOCR trim 28x28")
plt.show()
        epoch  test_accuracy
    0       1       0.975904
    1       2       0.979920
    2       3       0.983936
    3       4       0.975904
    4       5       0.983936
    5       6       0.975904
    6       7       0.991968
    7       8       0.971888
    8       9       0.971888
    9      10       0.975904
    10     11       0.979920
    11     12       0.971888
    12     13       0.979920
    13     14       0.987952
    14     15       0.983936
    15     16       0.987952
    16     17       0.979920
    17     18       0.987952
    18     19       0.979920
    19     20       0.979920
    20     21       0.983936
    21     22       0.983936
    22     23       0.971888
    23     24       0.979920
    24     25       0.983936
    25     26       0.987952
    26     27       0.983936
    27     28       0.987952
    28     29       0.975904
    29     30       0.987952
    30     31       0.983936
    31     32       0.979920
    32     33       0.979920
    33     34       0.979920
    34     35       0.967871
    35     36       0.975904
    36     37       0.971888
    37     38       0.983936
    38     39       0.983936
    39     40       0.963855
    40     41       0.979920
    41     42       0.967872
    42     43       0.967871
    43     44       0.983936
    44     45       0.983936
    45     46       0.987952
    46     47       0.983936
    47     48       0.987952
    48     49       0.975904
    49     50       0.983936
何気に記録更新だった。たまたま感あるけど。
import cPickle as pickle
import chainer
from chainer import cuda
import chainer.functions as F

def forward(x_data, y_data):
    x, t = chainer.Variable(x_data), chainer.Variable(y_data)
    h = F.max_pooling_2d(F.relu(model.conv1(x)), 2)
    h = F.max_pooling_2d(F.relu(model.conv2(h)), 2)
    h = F.dropout(F.relu(model.l1(h)), train=False)
    y = model.l2(h)

    return y, t,F.accuracy(y,t)

with open("./results/faxocr_trim_28_model_cnn_row.pkl", 'rb') as i:
    model = pickle.load(i)
from learn import read_imgs
test_data, test_label = read_imgs("./data/faxocr/test/trim_28")

test_data = test_data.reshape((len(test_data), 1, 28, 28))
test_data = test_data.astype(np.float32)
test_label = test_label.astype(np.int32)

y,t,acc = forward(test_data, test_label)
plt_num = 1
plt.figure(figsize=(10,10))
for i,(temp_y,temp_t,temp_test_data) in enumerate(izip(y.data,t.data, test_data)):
    if np.argmax(temp_y)!=temp_t:
        print "No.%d 正解:%d 出力:%d (%s)"%(i,temp_t, np.argmax(temp_y),temp_y)
        plt.subplot(2,2,plt_num)
        plt_num+=1
        plt.imshow(temp_test_data.reshape(28,28), cmap=plt.cm.gray_r)
plt.show()
    No.133 正解:9 出力:3 ([ -93.78523254  -76.56691742  -77.28510284   15.78890038  -87.52314758
      -58.99074554 -176.7293396  -101.68743896  -67.08155823   14.66318226])
    No.205 正解:9 出力:3 ([-44.00131989 -30.13937569 -40.71391678  17.24973297 -49.49590683
     -39.89061356 -82.53543091 -53.00856781   3.72428441   3.67775631])
    No.223 正解:9 出力:5 ([-24.54581642 -29.07642365 -31.50553131 -19.87841034 -23.92304039
      22.30206299 -18.75444031  -1.30475843 -20.22147751 -21.81653404])
    No.239 正解:5 出力:6 ([-12.27904129 -23.67368317 -23.48480606 -15.10187721 -11.83357048
       2.34730673   4.19125843 -13.38466549  -3.61155844 -24.05160713])
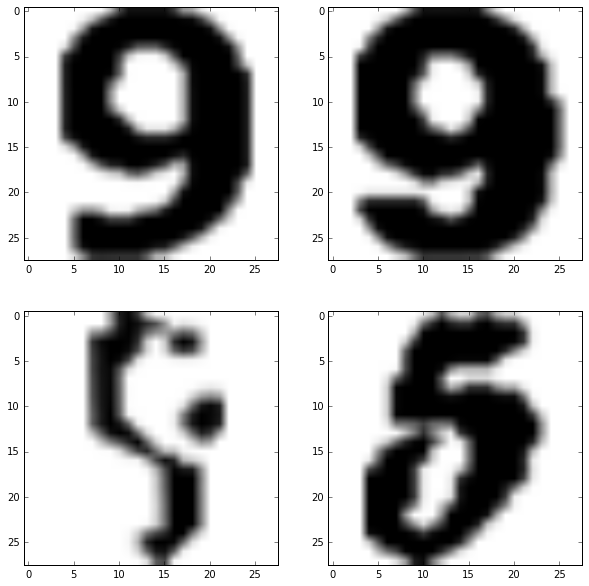
48x48
fig = plt.figure(figsize=[10,10])
accuracy = pd.read_csv("./results/faxocr_trim_48_accuracy_row.txt", sep="\t")
loss = pd.read_csv("./results/faxocr_trim_48_loss_row.txt", sep="\t")
print accuracy
accuracy["test_accuracy"].plot()
plt.ylim([0,1])
loss["train_loss"].plot()
plt.title("FaxOCR trim -> FaxOCR trim 48x48")
plt.show()
        epoch  test_accuracy
    0       1       0.967871
    1       2       0.967871
    2       3       0.971888
    3       4       0.971888
    4       5       0.959839
    5       6       0.975904
    6       7       0.967871
    7       8       0.967871
    8       9       0.975904
    9      10       0.971888
    10     11       0.975904
    11     12       0.979920
    12     13       0.963855
    13     14       0.975904
    14     15       0.975904
    15     16       0.971888
    16     17       0.967871
    17     18       0.963855
    18     19       0.967871
    19     20       0.975904
    20     21       0.967871
    21     22       0.963855
    22     23       0.975904
    23     24       0.971888
    24     25       0.967871
    25     26       0.967871
    26     27       0.971888
    27     28       0.971888
    28     29       0.963855
    29     30       0.963855
    30     31       0.975904
    31     32       0.967871
    32     33       0.963855
    33     34       0.979920
    34     35       0.971888
    35     36       0.967871
    36     37       0.979920
    37     38       0.979920
    38     39       0.967871
    39     40       0.975904
    40     41       0.975904
    41     42       0.975904
    42     43       0.975904
    43     44       0.979920
    44     45       0.975904
    45     46       0.979920
    46     47       0.979920
    47     48       0.975904
    48     49       0.975904
    49     50       0.975904
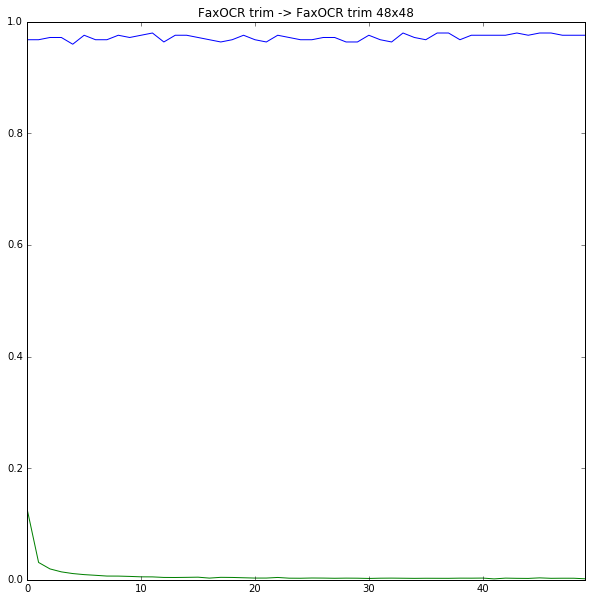
import cPickle as pickle
import chainer
from chainer import cuda
import chainer.functions as F

def forward(x_data, y_data):
    x, t = chainer.Variable(x_data), chainer.Variable(y_data)
    h = F.max_pooling_2d(F.relu(model.conv1(x)), 2)
    h = F.max_pooling_2d(F.relu(model.conv2(h)), 2)
    h = F.dropout(F.relu(model.l1(h)), train=False)
    y = model.l2(h)

    return y, t,F.accuracy(y,t)

with open("./results/faxocr_trim_48_model_cnn_row.pkl", 'rb') as i:
    model = pickle.load(i)
from learn import read_imgs
test_data, test_label = read_imgs("./data/faxocr/test/trim_48")

test_data = test_data.reshape((len(test_data), 1, 48, 48))
test_data = test_data.astype(np.float32)
test_label = test_label.astype(np.int32)

y,t,acc = forward(test_data, test_label)

plt_num = 1
plt.figure(figsize=(10,10))
for i,(temp_y,temp_t,temp_test_data) in enumerate(izip(y.data,t.data, test_data)):
    if np.argmax(temp_y)!=temp_t:
        print "No.%d 正解:%d 出力:%d (%s)"%(i,temp_t, np.argmax(temp_y),temp_y)
        plt.subplot(3,2,plt_num)
        plt_num+=1
        plt.imshow(temp_test_data.reshape(48,48), cmap=plt.cm.gray_r)
plt.show()
No.31 正解:7 出力:3 ([-37.6387825  -39.16486359 -42.47499466  16.941082   -35.50929642
 -28.37680244 -50.37080765 -18.17589951 -43.64836502 -26.19575882])
No.185 正解:3 出力:7 ([-21.7053051  -26.57409286 -22.67599106   5.41281748 -29.81308937
 -15.2016449  -49.91247177  11.7005167  -18.8066597  -14.08572674])
No.223 正解:9 出力:5 ([-26.99477196 -24.89096451 -43.02868652 -15.52783775 -25.02332115
  22.98989105 -17.69327545 -12.22776604 -12.18619633 -25.91065407])
No.228 正解:8 出力:9 ([ -4.70918608 -52.99452972 -28.40055275 -29.08706474   6.42821693
 -24.2097435  -52.58614731 -46.19430542 -14.41009426  12.67389202])
No.229 正解:2 出力:8 ([-22.11865997 -47.65965271  -1.94437969 -54.52325821 -24.92860031
 -19.47817802 -17.64678574 -40.01361084  26.35980225 -27.82418633])
No.239 正解:5 出力:8 ([ -3.87564874 -33.8475914  -27.65610313 -16.90502548 -28.28848457
 -23.67333221  -2.17319727 -35.55740356  22.8358345  -31.50007057])
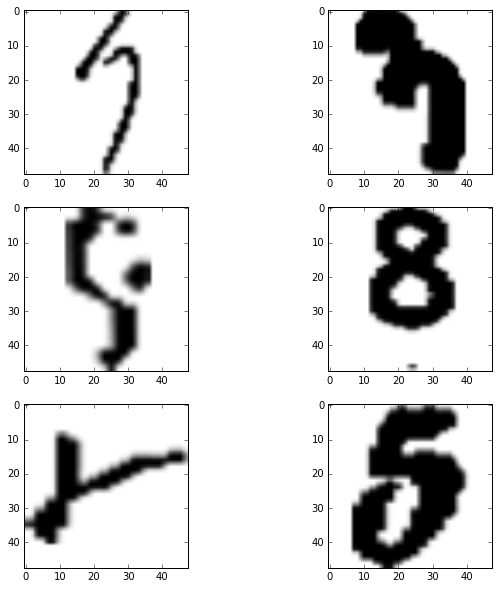
間違えちゃいけないデータを間違えているような気もするけど、前処理が適当で画像ぼけてるのがあれかも。 あとMNISTのデータとFaxOCRのデータをくっつけると汎化性能とか上がっていい感じかも。
あとは、データのaugmentationをもうちょっとちゃんとやるとか、複数のCNNでアンサンブル的なやつとかと思うけど、そのへんはよくわかってない
参考
FaxOCR手書き数字データの認識 その1
概要
FaxOCRという手書き数字認識の問題に挑戦した。 mnistで学習させたCNNでテストデータを判別すると正答率70%弱と低かった。 FaxOCRのデータだけで学習させたCNNでは96%程度の正答率だった。 mnistのデータとFaxOCRのデータはどうも違うようだけど、何が違うのかよくわからない。
以下はipython notebookの出力をちょこちょこいじったので、変なところがいくつかある。
はじめに
ツイッターを眺めているとこんなツイートを見つけた。
どうもFaxで送られてきた手書き数字を認識したいらしい。 はじめから電子データでいいんちゃうかとか、お役所も色々大変なんだろうなぁとか思いつつ。 手書き数字認識とかCNNに突っ込んだら終わりっしょぐらいの感じで始めた。先日公開したMNIST形式の手書き文字データですが、より精度の高い前処理を行った版を公開しました。それに合わせて、トレーニングデータも今までの4倍量を公開しました。元画像も公開中。文字認識タスクに興味のある方、お気軽にお試し下さい。https://t.co/wDq0lx59SL
— Takashi Okumura (@tweeting_drtaka) 2016年4月13日
FaxOCR
サイトはこちら
バイナリ形式で画像とラベルのセットが用意されている。mnistと同じ形式らしい。 やり始めた当時は学習データが1711画像だった(たぶん)。 mnistが70000枚とかなのを考えても、CNNに入れるにはだいぶ少ないなぁという印象だったので、mnistで学習させたCNNを使ってFaxOCRのテストデータを分類することにした。
mnistで学習させたCNN
mnistでCNNを学習させるというのはTensorFlowのチュートリアルにあるぐらい鉄板なので、ググるとたくさんヒットする。個人的にchainerの使い方なら、なんとなく習得しているので、こちら のchainerの実装を使わせてもらうことにした。 CNNやらのコードは完全にコピペなのでここには書かないが、エポック数だけ20から50に変更した。
学習結果はtest_accuracy=0.694779とむっちゃ低かった。 以下はエポック毎のaccuracy(青)と誤差関数(緑)。学習は進んでいるのに、accuracyが上がっていない。
%matplotlib inline
import pylab as plt
import pandas as pd

accuracy = pd.read_csv("./accuracy_mnist2fax.txt", sep="\t")
loss = pd.read_csv("./loss_mnist2fax.txt", sep="\t")
fig = plt.figure(figsize=[10,10])

accuracy["test_accuracy"].plot()
plt.ylim([0,1])
loss["train_loss"].plot(secondary_y=True)
plt.title("mnist->faxor")
plt.show()

mnistのデータをテストデータにすると以下のようになる。 lossは同じぐらいなのに、accuracyは1エポックの時点で0.98を超えている。
accuracy = pd.read_csv("./accuracy_mnist2mnist.txt", sep="\t")
loss = pd.read_csv("./loss_mnist2mnist.txt", sep="\t")
fig = plt.figure(figsize=[10,10])
accuracy["test_accuracy"].plot()
plt.ylim([0,1])#plt.ylim([0,1])
loss["train_loss"].plot(secondary_y=True)
plt.title("mnist->mnist")
plt.show()

一応、用意された学習データで学習すると以下のようになって、やっぱりデータ足りてない感がある。
accuracy = pd.read_csv("./accuracy_fax2fax.txt", sep="\t")
loss = pd.read_csv("./loss_fax2fax.txt", sep="\t")
fig = plt.figure(figsize=[10,10])
accuracy["test_accuracy"].plot()
plt.ylim([0,1])
loss["train_loss"].plot(secondary_y=True)
plt.title("faxor->faxor")
plt.show()

データを眺める
手書き数字といえばmnistでおっけーというイメージだったので、ちょっとショックだった。 精度が出ていない原因として、データが質的に異なっているという可能性があるので、色々と可視化してみることにした。
画像データ
何はともあれ学習データの画像を見る。以下は可視化のコード。全部表示すると多すぎるので、適当に10件ずつだけ。
%matplotlib inline
from read_data import read,show
from sklearn.datasets import fetch_mldata
import numpy as np

mnist = fetch_mldata('MNIST original', data_home=".")
X = mnist.data
y = mnist.target
X = X.astype(np.float32)
y = y.astype(np.int32)

X /= X.max()
X_train = X
y_train = y

data = read()

test_data = read(dataset="testing")
X_test = test_data[0]
y_test = test_data[1]
X_test = X_test.reshape(len(y_test), -1)
X_test = X_test / float(X_test.max())

import random
indecies = random.sample(range(len(X_train)), 1000)

for i in range(10):
    show(X_test[i].reshape(28,28))

print "###################################################"
print "############## mnist ここから######################"
print "###################################################"
for i in range(10):
    show(X_train[indecies[i]].reshape(28,28))


mnist ここから


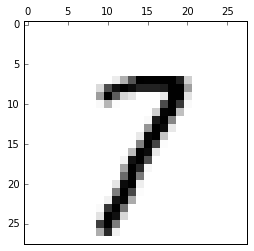

ぱっと見た感じ、mnistのほうが太い線で書かれたものが多い気がする。とはいえ、細い線のものもあるし、認識してくれてもいいんじゃないかという印象。
t-SNEによる可視化
なんかよくわからんときは、とりあえずt-SNEにぶちこむというのが最近のマイブーム。 このあたりが詳しい。 これとかをみると、PCAよりええんちゃうって思う。 scikit-learnに関数があるので、使うのはとても簡単。mnist全データを突っ込むとメモリが足りないと怒られたので、ランダムに1000点選んで描画した。
data = np.r_[X_train[indecies], X_test]

from sklearn.manifold import TSNE
model = TSNE(n_components=2)

tsned = model.fit_transform(data)
import pylab as plt
label = np.r_[["b" for i in X_train[:1000]], ["r" for i in X_test]]
plt.figure(figsize=(30,30))
plt.scatter(tsned[:,0], tsned[:,1], c=label, linewidths=0)
plt.show()

青(mnist)と赤(FaxOCR)のデータが明らかに分離している。こりゃあかんわって感じ。
データを増やしてCNN
そうこうしているうちに、こちらに精度を抜かれてしまっていた。
"適当に拡大縮小や回転をして画像データの枚数を11倍に(1枚から10枚生成)しました。"
とあって、すごく妥当だと思うし、なんで自分はこんなわけわからんことやってんだろうと思う。 とはいえ、精度で負けてるのはなんか悔しいので48x48のデータを51倍にしてCNNに突っ込んだ。
一応画像を適当に増やすところのコードは以下。
size = tuple(np.array([X_train[0].shape[1], X_train[0].shape[0]]))

new_imgs = []
new_labels = []
import random
import cv2
from itertools import izip
for img, label in izip(X_train, y_train):
    for i in range(50):
        rad = (random.random() - 0.5) * 0.5
        pos1 = (random.random() - 0.5) * 5
        pos2 = (random.random() - 0.5) * 5
        mat = np.float32([[np.cos(rad), -1 * np.sin(rad), pos1],
                          [np.sin(rad), np.cos(rad), pos2]])
        dst = cv2.warpAffine(img, mat, size, flags=cv2.INTER_LINEAR)
        new_imgs.append(dst)
        new_labels.append(label)
X_train = np.r_[X_train, new_imgs]
y_train = np.r_[y_train, new_labels]
accuracy(青)と誤差関数(緑)は以下。とりあえず96%とかいっているのでまあまあというところ。
accuracy = pd.read_csv("./accuracy_fax2fax_copied_48.txt", sep="\t")
loss = pd.read_csv("./loss_fax2fax_copied_48.txt", sep="\t")
fig = plt.figure(figsize=[10,10])
accuracy["test_accuracy"].plot()
plt.ylim([0,1])
loss["train_loss"].plot(secondary_y=True)
plt.title("faxor48->faxor48")
plt.show()

ちなみに間違っていた画像は以下。これはしょうがないんじゃないかと思うものが多い。(というか学習データのほうは大丈夫なんだろうか…)
%matplotlib inline

import cPickle as pickle
import numpy as np
import chainer
from chainer import cuda
import chainer.functions as F

xp=np


def forward(x_data, y_data):
    x, t = chainer.Variable(x_data), chainer.Variable(y_data)
    h = F.max_pooling_2d(F.relu(model.conv1(x)), 2)
    h = F.max_pooling_2d(F.relu(model.conv2(h)), 2)
    h = F.dropout(F.relu(model.l1(h)), train=False)
    y = model.l2(h)

    return y, t,F.accuracy(y,t)

with open("model_cnn_48.pkl", 'rb') as i:
    model = pickle.load(i)

from read_data import read, show
test_data = read(dataset="testing", size=48)
X_test = test_data[0].astype(xp.float32)
y_test = test_data[1].astype(xp.int32)
X_test = X_test.reshape(len(y_test), -1)
X_test = X_test / float(X_test.max())
X_test = X_test.reshape((len(X_test), 1, 48, 48))

y,t,acc = forward(X_test, y_test)
print "#################################"
print "accuracy: " + str(acc.data)
print "#################################"

from itertools import izip

for i,(temp_y,temp_t,temp_X_test) in enumerate(izip(y.data,t.data, X_test)):
    if np.argmax(temp_y)!=temp_t:
        print "No.%d 正解:%d 出力:%d (%s)"%(i,temp_t, np.argmax(temp_y),temp_y)
        show(temp_X_test.reshape(48,48))
accuracy: 0.967871487141
No.14 正解:9 出力:8 ([ 3.53644633 -66.54345703 -44.21648026 -30.54708862 -47.66264725 -61.4640274 -36.32198715 -54.34354401 28.37440872 14.29025173])

No.116 正解:9 出力:5 ([-35.68978119 -23.23931885 -76.64511108 -26.64510727 -42.89046097
      50.29698944 -16.02383232 -52.14741135 -22.0790844  -29.76072311])

    No.127 正解:9 出力:8 ([ -0.36938047 -72.61532593 -38.76506424 -25.25551796 -40.20273972
     -45.48267365 -41.19197464 -39.32862854  26.44895935  11.87366581])
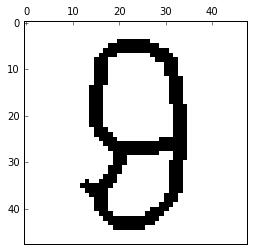
    No.170 正解:7 出力:1 ([-13.41542912   8.12284565 -28.43426895  -6.35744619 -42.47330093
     -31.51161766 -36.15800858  -0.18305674 -23.2899704  -10.80175686])

    No.172 正解:9 出力:1 ([-18.31829453   8.41508961 -24.00697708 -18.74674988 -15.38268757
     -19.12284851 -21.66376686 -29.5259037   -9.97081757   5.56778383])

    No.196 正解:9 出力:4 ([-25.27557564 -20.27404976 -33.58036041 -38.26721573  18.712677
     -17.12530899 -26.8935318  -34.70022964 -20.10196686  11.45114803])

   No.231 正解:5 出力:8 ([ -3.76606822 -27.21845436 -40.48172379 -41.74909592 -20.90390015
     -27.25065613   8.70675373 -39.89279938  28.23112106 -19.23669815])
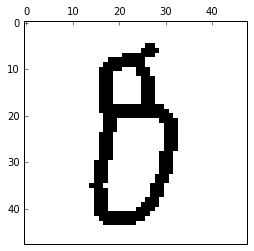
    No.247 正解:2 出力:4 ([-15.3788166   -8.5814476  -14.29022121 -16.61594963   5.68172646
      -8.83567333   0.14922404 -22.43881035 -17.46813393 -14.75987816])

mnistデータとFaxOCRデータの違い
データを公開された方の本来の目的からすると、パラメータチューニングとかして性能を上げたほうがいいのかもしれないけど、正直そっちにはあまり興味がない。Kaggleガチ勢の方がこういうの とか出してくれているので、参考にするといいのかもしれない。
個人的に気になったのは今回のデータとmnistの違い。 見た目は同じような手書き文字なのに、t-sneで可視化すると明らかに分離している。 Faxのデータはどうも線の細さを統一したり、回転させたりと前処理を結構しているらしいので、それが影響しているのかなと思った。 なので、生データを可視化してみる。FaxOCRの画像サイズはまちまちだったので、ImageMagickで28x28にリサイズした。アスペクト比は保存していないのでややまずい。
import cv2 as cv
import glob
mnist = fetch_mldata('MNIST original', data_home=".")
X = mnist.data
y = mnist.target
X = X.astype(np.float32)
y = y.astype(np.int32)

X /= X.max()
X_train = X
y_train = y

X_test = []
y_test = []
for img_file in glob.glob("./data/mustread/28/*.png"):
    y_test.append(int(img_file[16]))
    X_test.append(255 - cv.imread(img_file, flags=0))

data_row = np.r_[X_train[indecies], np.array(X_test).reshape(len(X_test),-1)]
from sklearn.manifold import TSNE
model = TSNE(n_components=2)

tsned_row = model.fit_transform(data_row)
label = np.r_[["b" for i in range(1000)], ["r" for i in X_test]]
plt.figure(figsize=(30,30))
plt.scatter(tsned_row[:,0], tsned_row[:,1], c=label, linewidths=0)
plt.show()

なんでや…
ミス訂正(2016/4/26)
FaxOCRのほうが0~1に補正されていなかった。正しいt-SNEの結果は以下。
 これなら、線が細いやつが固まっていると思えば、まだありえる(?)
一旦終わり
正直なにがダメなのかよくわかってない。というかバグなんじゃないのか、僕のコードがなにかやらかしてるんじゃないのか。 見た目おんなじに見えるんだけど、何か本当に違うのか… 誰かバグとか根本的な間違いとか見つけたら教えてください…
ミス訂正(2016/4/26)
コードにミスがあったので、元画像データはmnistの一部がある空間にありそうだとわかった。時間があるときにもうちょっとちゃんとやって追記します。
続き
参考
- テストデータ (MNIST IDX形式) - Shinsai FaxOCR
- Chainerによる畳み込みニューラルネットワークの実装 - 人工知能に関する断創録Chainerによる畳み込みニューラルネットワークの実装 - 人工知能に関する断創録
- t-SNE を用いた次元圧縮方法のご紹介 | ALBERT Official Blogt-SNE を用いた次元圧縮方法のご紹介 | ALBERT Official Blog
- Digit Recognizer | Kaggle
- FaxOCR を CNN でやってみた | ZABURO app
- kaggle-digit-recognizer/2_model.lua at master · toshi-k/kaggle-digit-recognizer · GitHub
omake+latexdiff-gitで作る最強のTeX環境
この記事のやつはもうやってない
最近はlatexmkで自動コンパイルして,査読をお願いするときだけlatexdiffを使って差分ファイルを作っている
デモ
これがぼくのかんがえたさいきょうのてふかんきょうだ。
概要
omakeでディレクトリの変更を監視して、TeXファイルを自動コンパイルする。 コンパイル時にlatexdiff-gitで前回のコミットとの差分を出力し、それもコンパイルする。
はじめに
最近周りでTeXを書いている人があまりいない。Word派の主張を聞いているとどうもコンパイルがイケてないらしい。 実際、TeXを書いているときにいちいちmakeとか叩くのは正直だるい。 (コマンドとか無理という主張はどうしようもないので無視した)
探しているとこんな最高の記事を見つけた。 導入するついでに以前書いたものを合体させて、 自動で本体と差分のpdfを出力するようにする。
- OMake 0.9.8.5
- latexdiff 1.0.2
omake
omakeについては、こちらを参考にした。 omakeはなんかよくわからんけど、makeの代わりに使えるもの。 まだ全く調べてないけど、今回使ったディレクトリ監視だけでなく他にも色々できそう。
aptでインストールする。 famというのはディレクトリの監視に必要らしい。
$ sudo apt-get install omake fam
$ omake --install
とすると、OMakefileとOmakerootというファイルが生成される。
latexdiff
こちらを参考にして日本語に対応する必要がある。
latexdiffについては以前こんなものを書いた。 以前の記事では以下のようなコマンドを叩いて差分ファイルを生成していたが、
git ldiff HEAD~1 > diff.tex
色々いじっているうちに、 latexdiff-gitというコマンドが用意されていることに気づいた。 このコマンドを使うと以下のように簡単に前回のコミットとの差分をTeX形式で出力できる。
latexdiff-git -r -e utf8 test.tex
合体させる
こちらと こちらの記事にあるOMakefileにlatexdiffの部分を追記して、以下のようなOmakefileを作った。
TARGET = test
DIFF = test-diff
IMAGE_DIR = figs

LATEX = platex
BIBTEX = pbibtex
DVIPDFM = dvipdfmx
LATEXDIFF = latexdiff-git

DIFFFLAGS = -r -e utf8 --force

# Bounding Box生成コマンド
EBB = extractbb

# グロブ展開に失敗したときに空の文字列を返すようにする
GLOB_OPTIONS = i

# Bounding Boxの生成ルール
.SUBDIRS: $(IMAGE_DIR)
    %.xbb: %.png
        $(EBB) $<
    %.xbb: %.jpg
        $(EBB) $<
    %.xbb: %.pdf
        $(EBB) $<

TEX_FILES = $(glob *.tex */*.tex)
BIB_FILES = $(glob *.bib)
EPS_IMAGE_FILES = $(glob $(IMAGE_DIR)/*.eps)
OTHER_IMAGE_FILES = $(glob $(IMAGE_DIR)/*.png $(IMAGE_DIR)/*.jpg $(IMAGE_DIR)/*.pdf)
IMAGE_FILES = $(EPS_IMAGE_FILES) $(OTHER_IMAGE_FILES)
XBB_FILES = $(addsuffix .xbb, $(removesuffix $(OTHER_IMAGE_FILES)))

# コンパイルに必要なファイル
TEXDEPS[] = $(TEX_FILES) $(BIB_FILES) $(IMAGE_FILES) $(XBB_FILES)

LaTeXDocument($(TARGET), $(TARGET))
LaTeXDocument($(DIFF), $(DIFF))

.DEFAULT: $(TARGET).pdf $(DIFF).pdf

$(DIFF).tex:$(TARGET).tex
  $(LATEXDIFF) $(DIFFFLAGS) $<

.PHONY: clean
clean:
    rm $(glob *.toc *.log *.pdf *.dvi *.fls *.aux *.maf *.mtc *.bbl *.blg) $(XBB_FILES)
Emacsユーザーなら
after-save-hook にmakeを設定するだけでもいいじゃないかという気もする。
参考
raspberry pi2 + カメラ付きサーボで特定の色を追っかけるカメラを作る
Table of Contents
概要
raspberry pi2 を使ってカメラ付きサーボモータを制御した。 python+OpenCVで特定の色の中心を追っかけるようにした。 かくかくしてるけどだいたい良い。
はじめに
学生の頃、ロボットに触る機会はよくあったが、だいたい「これが見えたらあっちに歩け」ぐらいの抽象度で、モータの角度を何度にするとか、電気回路がどうとかはさっぱりわからない。 仮にも機械工学科目を修めておいてこれではいけないなと思って、とりあえず部屋に転がっていたサーボモータを動かしてみることにした。
使用したもの
- 秋月のwebカメラ付きサーボ
- raspberry pi2
- ブレッドボードなど
画像中の特定の色の中心を求める
OpenCVを使って何も考えずに書くと以下のようになる。 今回は青色を追っかけるようにした。
import cv2
import numpy as np

capture = cv2.VideoCapture(0)
capture.set(3, 320)
capture.set(4, 240)

dst = np.zeros((320, 240), dtype=np.uint8)

while True:
    _, img = capture.read()
    dst = cv2.cvtColor(img, cv2.COLOR_BGR2HSV)
    conditions = (dst[:,:,0]<150)*1 * ((dst[:,:,0]>90)*1) * (dst[:,:,1]>100)

    sum_x = 0
    sum_y = 0
    sum_item = 0
    for x,row in enumerate(conditions):
        for y,item in enumerate(row):
            sum_x += x * item
            sum_y += y * item
            sum_item += item
    mean_x = sum_x / sum_item
    mean_y = sum_y / sum_item

    cv2.circle(img, (mean_y, mean_x),10, (0,0,255), -1)
    cv2.imshow("camera", img)
    cv2.waitKey(1)

capture.release()
cv2.destroyAllWindows()
pythonを使っている人にはわかると思うが、このプログラムはとんでもなく遅い。 実際にラズパイで実行してみると体感2fpsぐらいだった。 というわけで、以下のように書き換えた。
import cv2
import numpy as np

capture = cv2.VideoCapture(0)
capture.set(3, 320)
capture.set(4, 240)

while True:
    _, img = capture.read()
    dst = cv2.cvtColor(img, cv2.COLOR_BGR2HSV)
    conditions = (dst[:,:,0]<150)*1 * ((dst[:,:,0]>90)*1) * (dst[:,:,1]>100)

    sum_item = np.sum(conditions)
    t_conditions = np.transpose(conditions)

    temp = range(len(conditions))
    mean_x = np.sum([temp * t_condition for t_condition in t_conditions])/sum_item
    temp = range(len(t_conditions))
    mean_y = np.sum([temp * condition for condition in conditions])/sum_item

    cv2.circle(img, (mean_y, mean_x),10, (0,0,255), -1)
    cv2.imshow("camera", img)
    cv2.waitKey(1)

capture.release()
cv2.destroyAllWindows()
これでまあ満足できる程度の早さになる。 実行するとこのようになる。

サーボモータを制御する
回路を適当に組む。 サーボの動作電圧が4.8Vだったので、電池を3つつなげて4.5Vで使用した。 サーボの信号線をラズパイのPWMができるピンに接続する。

ラズパイのピンのレイアウトはこちらを参考にした。 PWMで制御するために今回はGPIO13と18を使う。
こちら を参考にしてモータを動かしてみる。
import wiringpi2

PWM_PIN = 13
#PWM_PIN = 18
DUTY_MAX = 123 # 90°
DUTY_MIN = 26  # -90°
DUTY_HOME = 74 # 0°
duty = 0

wiringpi2.wiringPiSetupGpio()
wiringpi2.pinMode(PWM_PIN, wiringpi2.GPIO.PWM_OUTPUT)
wiringpi2.pwmSetMode(wiringpi2.GPIO.PWM_MODE_MS)
wiringpi2.pwmSetClock(375)

wiringpi2.pwmWrite(PWM_PIN, DUTY_HOME)
wiringpi2.delay(100)

def move(degree):
    duty = int((DUTY_MAX-DUTY_MIN)/180.0 * degree + DUTY_HOME)
    wiringpi2.pwmWrite(PWM_PIN, duty)

for degree in [0,45,90,0,-45,-90,0,30,-30,0]:
    move(degree)
    wiringpi2.delay(500)
実行するとこんな感じで動く。

青色を追っかける
2つのプログラムを組み合わせる。
import wiringpi2
import cv2
import numpy as np

PIN_X = 13
PIN_Y = 18
DUTY_MAX = 123 # 90°
DUTY_MIN = 26  # -90°
DUTY_HOME = 74 # 0°
duty = 0

wiringpi2.wiringPiSetupGpio()
wiringpi2.pinMode(PIN_X, wiringpi2.GPIO.PWM_OUTPUT)
wiringpi2.pinMode(PIN_Y, wiringpi2.GPIO.PWM_OUTPUT)
wiringpi2.pwmSetMode(wiringpi2.GPIO.PWM_MODE_MS)
wiringpi2.pwmSetClock(375)

wiringpi2.pwmWrite(PIN_X, DUTY_HOME)
wiringpi2.pwmWrite(PIN_Y, DUTY_HOME)
wiringpi2.delay(100)

def move(degree_x, degree_y):
    duty_x = int((DUTY_MAX-DUTY_MIN)/180.0 * degree_x + DUTY_HOME)
    duty_y = int((DUTY_MAX-DUTY_MIN)/180.0 * degree_y + DUTY_HOME)
    wiringpi2.pwmWrite(PIN_X, duty_x)
    wiringpi2.pwmWrite(PIN_Y, duty_y)
    wiringpi2.delay(100)

def detect_blue_center(img):
    dst = cv2.cvtColor(img, cv2.COLOR_BGR2HSV)
    conditions = (dst[:,:,0]<150)*1 * ((dst[:,:,0]>90)*1) * (dst[:,:,1]>100)
    sum_item = np.sum(conditions)
    t_conditions = np.transpose(conditions)

    temp = range(len(conditions))
    mean_x = np.sum([temp * t_condition for t_condition in t_conditions])/sum_item
    temp = range(len(t_conditions))
    mean_y = np.sum([temp * condition for condition in conditions])/sum_item
    return mean_x, mean_y

capture = cv2.VideoCapture(0)
capture.set(3, 320)
capture.set(4, 240)

now_angle_x = 0
now_angle_y = 0

while True:
    _, img = capture.read()
    mean_x, mean_y = detect_blue_center(img)
    cv2.circle(img, (mean_y, mean_x),10, (0,0,255), -1)

    angle_x = (mean_x - 160)/160.0*7
    angle_y = -(mean_y - 120)/120.0*7
    move(now_angle_y + angle_y, now_angle_x + angle_x)
    now_angle_y = now_angle_y + angle_y
    now_angle_x = now_angle_x + angle_x

    cv2.imshow("camera", img)
    cv2.waitKey(1)

capture.release()
cv2.destroyAllWindows()
実行するとこんな感じ。
かくかくしてるし、ラグがあって微妙だけど動くからいいかな。

おわりに
かくかくしてるのとかラグとか直すべきところはいっぱいあるけど、特に目標があって始めたわけでもないからやる気がでない。
追記(3月4日)
なんとなくdelayを入れていたけど、とってみるとカクカクしなくなった。金麦飲んでたせいで気づかなかったわー金麦のせいだわー。 ついでに画像サイズ小さくしたらかなりよくなった。