FaxOCR手書き数字データの認識 その2
%matplotlib inline
import pylab as plt
import pandas as pd
import numpy as np
概要
前回、FaxOCRという手書き数字のデータの認識をやった。 認識自体はぼちぼちできたが、MNISTデータで学習させたCNNで認識を行うといまいちだったのが気になった。 バグやミスの可能性を潰してもう一度やってみたけど、同様にうまくいかなかった。 データを見ていると文字のサイズが異なっていることに気づいた。 サイズを統一してやってみると、MNISTデータで学習させたCNNである程度正しく予測することができた。
はじめに
前回、FaxOCRという手書き数字のデータの認識をやった。 学習データを回転させるなどしてデータを増やして、CNNを使って学習させると、96%ぐらいの精度で予測することができた。 一方で、MNISTのデータを使って学習させたCNNでは70%弱でしか当てることができなかった。 自分のプログラムや計算にミスがある可能性も考えながら、色々やる。 今回はMNISTデータとの違いを見ることが目的なので、FaxOCRのデータは全て前処理されていない元画像データ(numbers-sample, mustread)を使った。 FaxOCRについてはこちら。
ミスの可能性をなくす
全部画像データに変換する
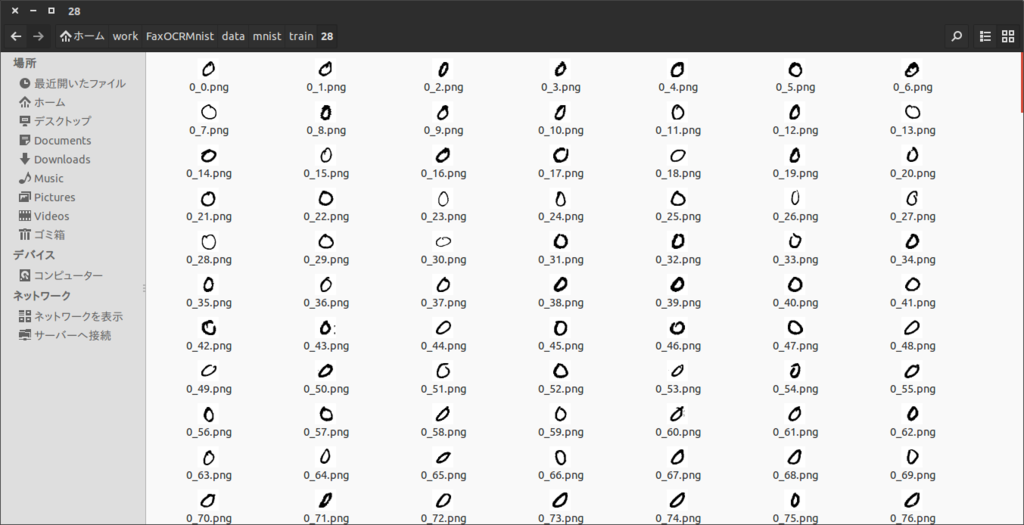
前回はMNISTのデータをバイナリで読み込んでCNNやt-SNEに突っ込んでいた。やらかしているならここだなと思って、とりあえず全部pngにした。
import pylab as plt
from sklearn.datasets import fetch_mldata
import numpy as np


def save(image, name):
    fig = plt.figure()
    ax = fig.add_subplot(1, 1, 1)
    imgplot = ax.imshow(image, cmap=plt.cm.Greys)
    imgplot.set_interpolation('nearest')
    ax.xaxis.set_ticks_position('top')
    ax.yaxis.set_ticks_position('left')
    plt.imsave(name)
    # plt.savefig(name) # savefigだとグラフの軸も描画される

mnist = fetch_mldata('MNIST original', data_home=".")
y = mnist.target
X = - mnist.data.reshape(len(y), 28, 28) + 255

counter = np.zeros(10)
from itertools import izip
for image, label in izip(X, y):
    label = int(label)
    plt.imsave("%d_%d.png" % (label, counter[label]), image, cmap=plt.cm.gray)
    counter[label] += 1
プレビューが死ぬほど重いけど、特に問題なさそう。
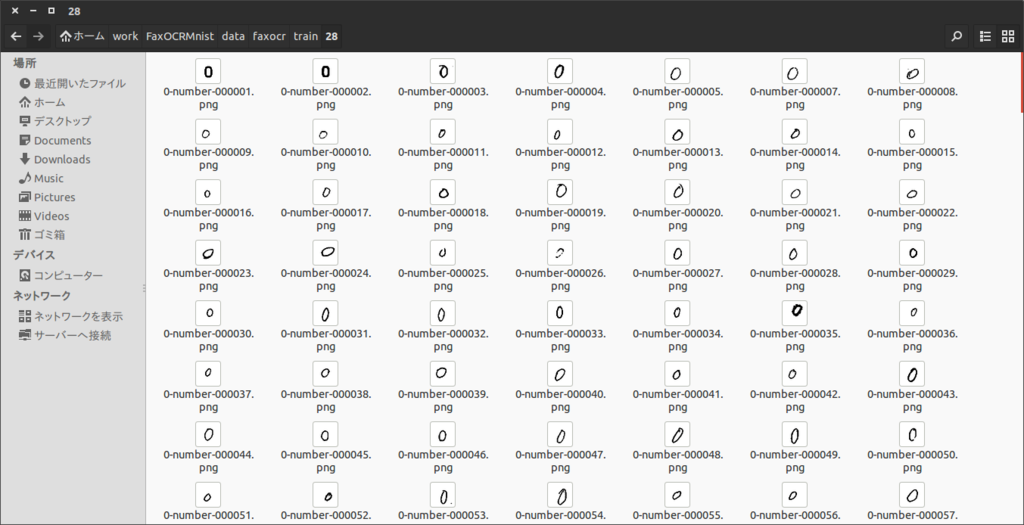
FaxOCR
MNIST
FaxOCRのデータは以下のようにImageMagicを使って、28x28に変えた。
for i in *
do
convert -resize 28x28! $i ../28/$i
done
CNNのコードを書き直す
ネットにあったコードを行き当りばったりな感じで編集してコードを書いていた。 コメントアウトで条件変えたり、ミスしてそうなところがあったので、そこそこちゃんと書き直す。(書きなおしたあと色々あってまた行き当りばったり的なコードになっているけど気にしない)
learn.py
# -*- coding: utf-8 -*-
import numpy as np
import glob
import cv2 as cv
from itertools import izip
import random

from cnn import cnn


def read_imgs(dirname, labelpos=1):
    imgs = []
    labels = []
    for img_file in glob.glob(dirname + "/*.png"):
        imgs.append((255 - cv.imread(img_file, flags=0)) / 255.0)
        labels.append(int(img_file[len(dirname) + labelpos]))
    return np.array(imgs), np.array(labels)


def learn(train="faxocr", imsize="28"):
    X_test, y_test = read_imgs("./data/faxocr/test/%s" % imsize)

    # if train == "mnist":
    #     assert(int(imsize) == 28)
    X_train, y_train = read_imgs("./data/%s/train/%s" % (train, imsize))

    size = tuple(np.array([X_train[0].shape[1], X_train[0].shape[0]]))

    if train == "faxocr":
        new_imgs = []
        new_labels = []
        for img, label in izip(X_train, y_train):
            for i in range(20):
                rad = (random.random() - 0.5) * 0.5
                pos1 = (random.random() - 0.5) * 5
                pos2 = (random.random() - 0.5) * 5
                mat = np.float32([[np.cos(rad), -1 * np.sin(rad), pos1],
                                  [np.sin(rad), np.cos(rad), pos2]])
                dst = cv.warpAffine(img, mat, size, flags=cv.INTER_LINEAR)
                new_imgs.append(dst)
                new_labels.append(label)
        X_train = np.r_[X_train, new_imgs]
        y_train = np.r_[y_train, new_labels]
    cnn(X_train, y_train,
        X_test,  y_test,
        #        "./results/" + train + "_%s_" % imsize, size=imsize)
        "./results/" + train + "_%s_" % imsize, size=28)

if __name__ == '__main__':
    learn(train="mnist", imsize="trim_28")
cnn.py
# coding: utf-8
import numpy as np
import chainer
from chainer import cuda
import chainer.functions as F
from chainer import optimizers
import time


def cnn(train_data, train_label,
        test_data,  test_label,
        resultname_header,
        n_epoch=50, batchsize=100,
        size=28):

    cuda.check_cuda_available()
    xp = cuda.cupy

    N = train_label.size
    N_test = test_label.size

    train_data = train_data.reshape(len(train_label), -1)
    train_data = train_data.astype(xp.float32)
    train_label = train_label.astype(xp.int32)
    test_data = test_data.reshape(len(test_label), -1)
    test_data = test_data.astype(xp.float32)
    test_label = test_label.astype(xp.int32)

    train_data = train_data.reshape((len(train_data), 1, size, size))
    test_data = test_data.reshape((len(test_data), 1, size, size))

    print test_data.shape
    print train_data.shape

    print test_data.mean()
    print train_data.mean()

    if size == 28:
        model = chainer.FunctionSet(conv1=F.Convolution2D(1, 20, 5),
                                    conv2=F.Convolution2D(20, 50, 5),
                                    l1=F.Linear(800, 500),
                                    l2=F.Linear(500, 10))

    else:
        model = chainer.FunctionSet(conv1=F.Convolution2D(1, 20, 3),
                                    conv2=F.Convolution2D(20, 50, 3),
                                    l1=F.Linear(6050, 800),
                                    l2=F.Linear(800, 10))

    cuda.get_device(0).use()
    model.to_gpu()

    def forward(x_data, y_data, train=True):
        x, t = chainer.Variable(x_data), chainer.Variable(y_data)
        h = F.max_pooling_2d(F.relu(model.conv1(x)), 2)
        h = F.max_pooling_2d(F.relu(model.conv2(h)), 2)
        h = F.dropout(F.relu(model.l1(h)), train=train)
        y = model.l2(h)
        if train:
            return F.softmax_cross_entropy(y, t)
        else:
            return F.accuracy(y, t)

    optimizer = optimizers.Adam()
    # optimizer = optimizers.RMSprop()
    optimizer.setup(model)

    fp1 = open(resultname_header + "accuracy_row.txt", "w")
    fp2 = open(resultname_header + "loss_row.txt", "w")

    fp1.write("epoch\ttest_accuracy\n")
    fp2.write("epoch\ttrain_loss\n")


    start_time = time.clock()
    for epoch in range(1, n_epoch + 1):
        print "epoch: %d" % epoch

        perm = np.random.permutation(N)
        sum_loss = 0
        for i in range(0, N, batchsize):
            x_batch = xp.asarray(train_data[perm[i:i + batchsize]])
            y_batch = xp.asarray(train_label[perm[i:i + batchsize]])

            optimizer.zero_grads()
            loss = forward(x_batch, y_batch)
            loss.backward()
            optimizer.update()
            sum_loss += float(loss.data) * len(y_batch)

        print "train mean loss: %f" % (sum_loss / N)
        fp2.write("%d\t%f\n" % (epoch, sum_loss / N))
        fp2.flush()

        sum_accuracy = 0
        for i in range(0, N_test, batchsize):
            x_batch = xp.asarray(test_data[i:i + batchsize])
            y_batch = xp.asarray(test_label[i:i + batchsize])

            acc = forward(x_batch, y_batch, train=False)
            sum_accuracy += float(acc.data) * len(y_batch)

        print "test accuracy: %f" % (sum_accuracy / N_test)
        fp1.write("%d\t%f\n" % (epoch, sum_accuracy / N_test))
        fp1.flush()

    end_time = time.clock()
    print end_time - start_time

    fp1.close()
    fp2.close()

    import cPickle
    model.to_cpu()
    cPickle.dump(model, open(resultname_header + "model_cnn_row.pkl", "wb"), -1)
学習結果
ミスしそうなところはだいたい直したので、もう一度CNNを使って学習させてみた。以下は結果。
FaxOCR -> FaxOCR (28x28)
accuracy = pd.read_csv("./results/faxocr_28_accuracy_row.txt", sep="\t")
loss = pd.read_csv("./results/faxocr_28_loss_row.txt", sep="\t")

fig = plt.figure(figsize=[10,10])
accuracy["test_accuracy"].plot()
plt.ylim([0,1])
loss["train_loss"].plot()
plt.title("FaxOCR->FaxOCR")
plt.show()
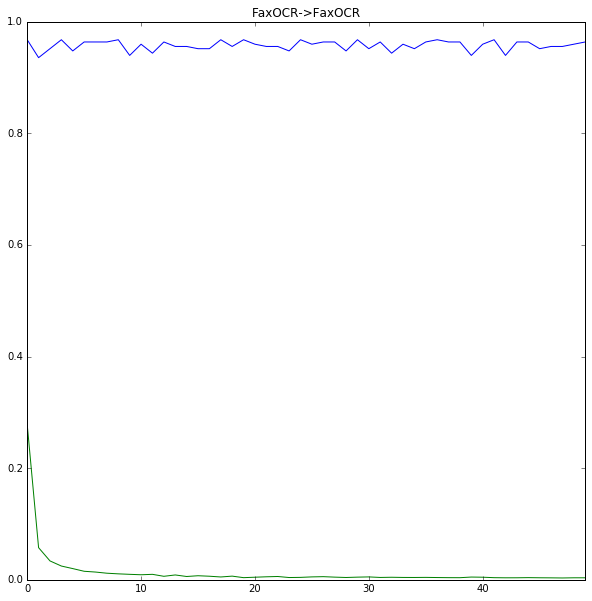
これは前回と同様な感じ。だいたいOK。
MNIST -> FaxOCR (28x28)
accuracy = pd.read_csv("./results/mnist_28_accuracy_row.txt", sep="\t")
loss = pd.read_csv("./results/mnist_28_loss_row.txt", sep="\t")

fig = plt.figure(figsize=[10,10])
accuracy["test_accuracy"].plot()
plt.ylim([0,1])
loss["train_loss"].plot()
plt.title("MNIST->FaxOCR")
plt.show()

残念ながらこれも前回と同じ。どうもミスとかではなく、普通にダメそう。 loss自体は下がっているので、MNISTとFaxOCRのデータが何かしら違うことが原因っぽい。
データをみる
個々のデータを目で見ていても、特に不自然なところはないように感じたので、色々絵を描いてみて考えることにした。
from learn import read_imgs

mnist_data,  mnist_label  = read_imgs("./data/mnist/train/28")
faxocr_data, faxocr_label = read_imgs("./data/faxocr/train/28")

print mnist_data.mean()
print faxocr_data.mean()
0.131017957897
0.079225616316
画素の平均値が違っているのが少し気になる。
t-SNE
まずは僕の大好きなt-SNEで絵を描く。 前回はMNISTを1000個とFaxOCRのテストデータを使って可視化したけど、今回はMNISTデータ7000個とFaxOCRの学習データ6709個を使った。
num_mnist = 7000

import random
indecies = random.sample(range(len(mnist_data)), num_mnist)

data = np.r_[mnist_data[indecies].reshape(num_mnist, -1), faxocr_data.reshape(len(faxocr_data),-1)]

from sklearn.manifold import TSNE
model = TSNE(n_components=2)
tsned = model.fit_transform(data)
label = np.r_[["b" for i in range(num_mnist)], ["r" for i in range(len(faxocr_data))]]
plt.figure(figsize=(30,30))
plt.scatter(tsned[:,0], tsned[:,1], c=label, linewidths=0)
plt.show()
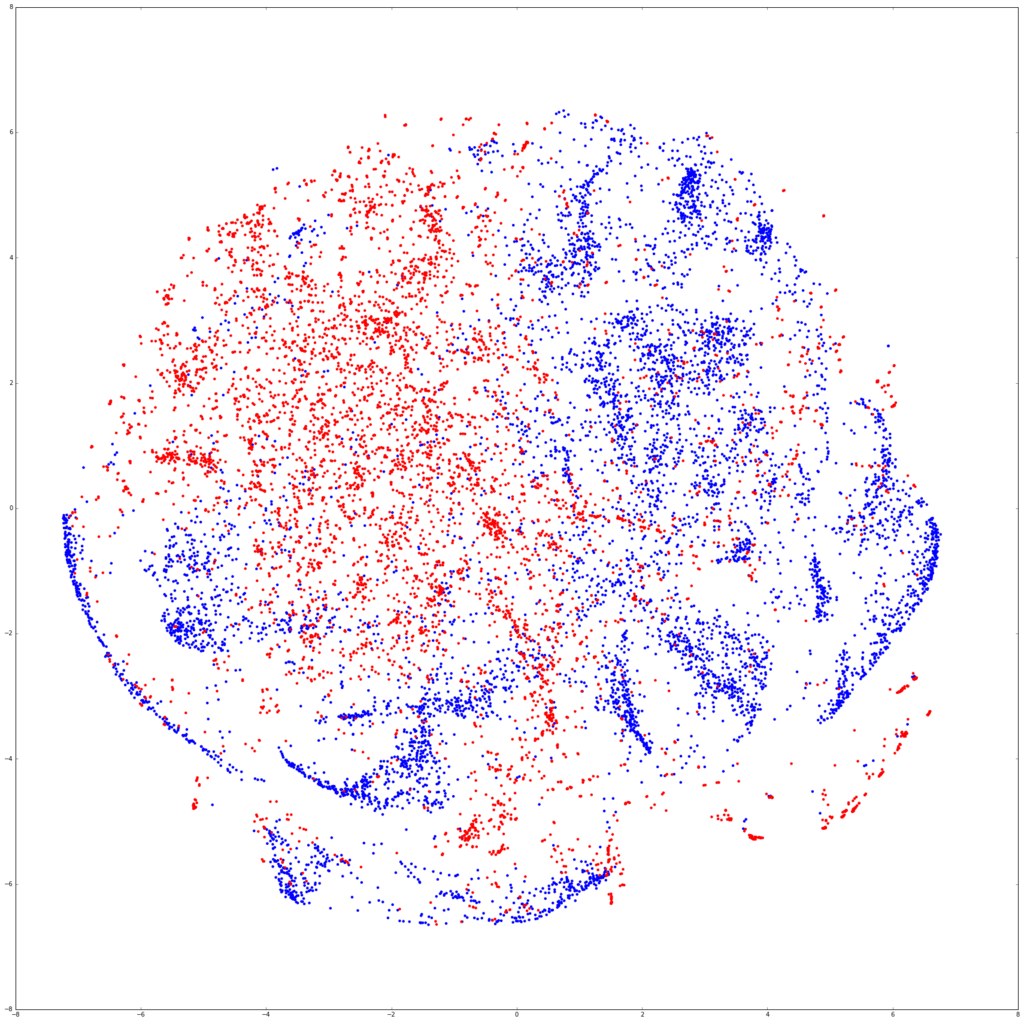
青がMNIST、赤がFaxOCR。分離してるなぁーって感じの図。わかりにくいので、数字ごとに図を描いてみる。
fig = plt.figure(figsize=(30,40))
for num in range(10):
    fig.add_subplot(4,3,num+1)
    label = np.r_[["b" if i==num else "w" for i in mnist_label[indecies]], ["r" if i==num else "w" for i in faxocr_label]]
    plt.scatter(tsned[:,0], tsned[:,1], c=label, linewidths=0, alpha=0.6, marker=".")
    plt.title(str(num))
plt.show()
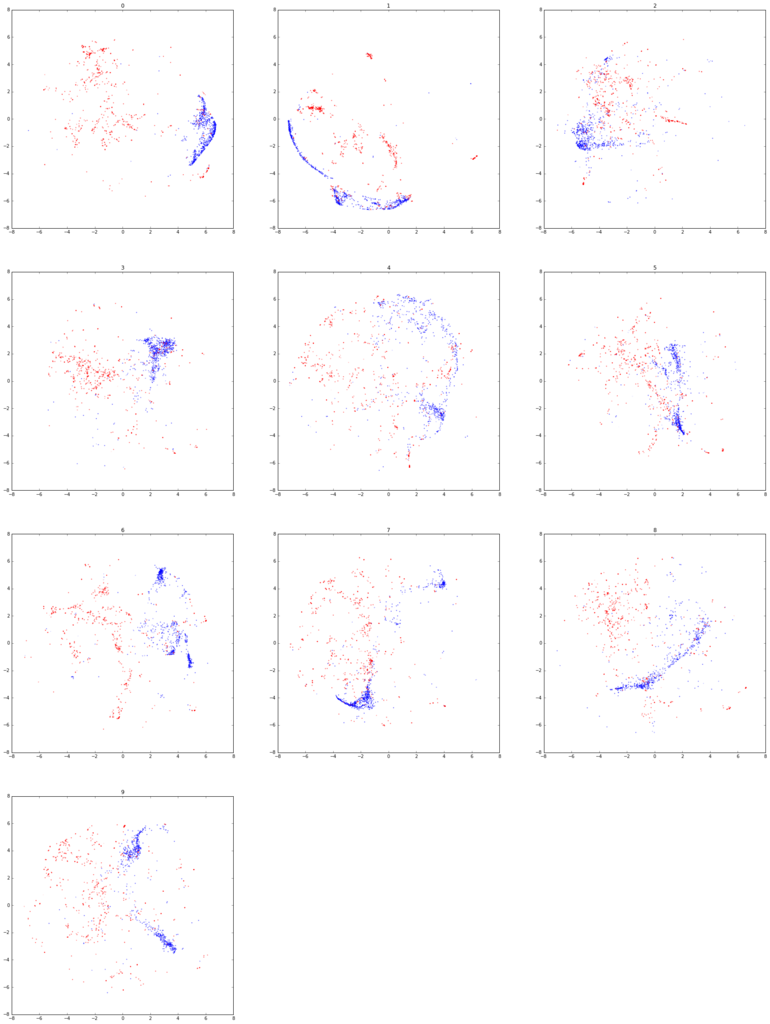
まあだめでしょうねって感じの図になった。
ちょっと気になったので、FaxOCRデータとMNISTデータそれぞれでt-SNEして図を描いてみる。
model_faxocr = TSNE(n_components=2)
tsned_faxocr = model_faxocr.fit_transform(faxocr_data.reshape(len(faxocr_data),-1))
model_mnist = TSNE(n_components=2)
tsned_mnist = model_faxocr.fit_transform(mnist_data[indecies].reshape(num_mnist,-1))

plt.figure(figsize=(20,10))
plt.subplot(121)
plt.title("FaxOCR")
plt.scatter(tsned_faxocr[:,0], tsned_faxocr[:,1], c=faxocr_label, linewidths=0, marker=".")
plt.subplot(122)
plt.title("MNIST")
plt.scatter(tsned_mnist[:,0], tsned_mnist[:,1], c=mnist_label[indecies], linewidths=0, marker=".")
plt.show()
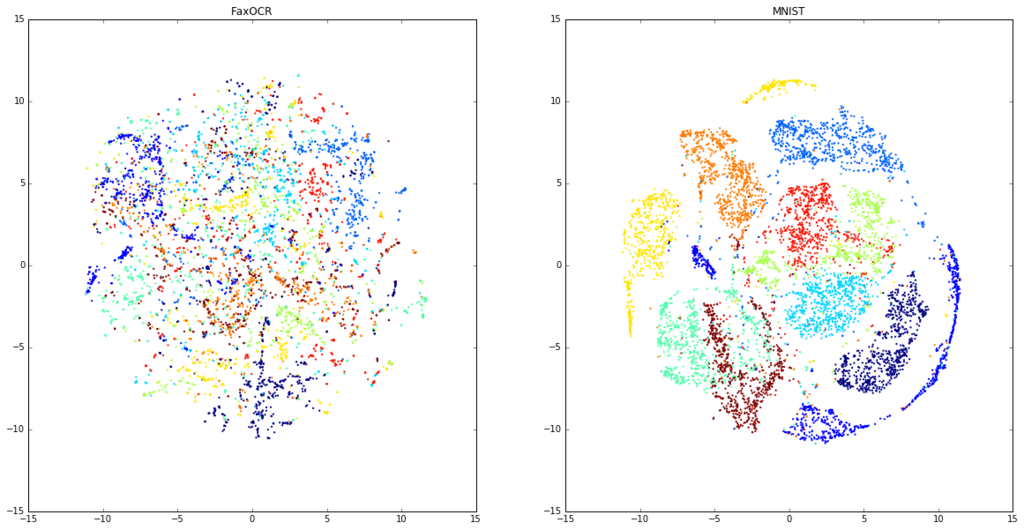
なんだこれは。MNISTの方はすごいきれいに分かれているのに。
ちなみに回転させたデータを入れたFaxOCRのデータを可視化すると以下。
new_imgs = []
new_labels = []
size = tuple(np.array([faxocr_data[0].shape[1], faxocr_data[0].shape[0]]))

from itertools import izip
import cv2 as cv
for img, label in izip(faxocr_data, faxocr_label):
    for i in range(20):
        rad = (random.random() - 0.5) * 0.5
        pos1 = (random.random() - 0.5) * 5
        pos2 = (random.random() - 0.5) * 5
        mat = np.float32([[np.cos(rad), -1 * np.sin(rad), pos1],
                          [np.sin(rad), np.cos(rad), pos2]])
        dst = cv.warpAffine(img, mat, size, flags=cv.INTER_LINEAR)
        new_imgs.append(dst)
        new_labels.append(label)
many_data = np.r_[faxocr_data, new_imgs]
many_label = np.r_[faxocr_label, new_labels]

fax_indecies = random.sample(range(len(many_data)), num_mnist)

model_many = TSNE(n_components=2)
tsned_many = model_many.fit_transform(many_data.reshape(len(many_data),-1)[fax_indecies])

plt.figure(figsize=(10,10))
plt.scatter(tsned_many[:,0], tsned_many[:,1], c=many_label[fax_indecies], linewidths=0, marker=".")
plt.show()
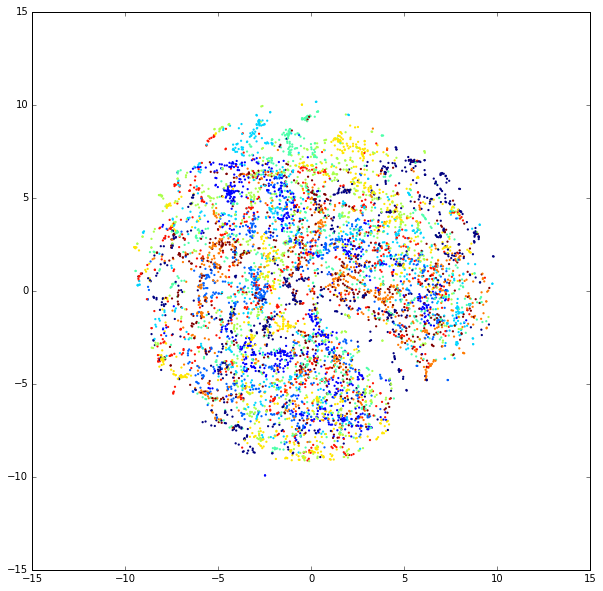
このデータ分離できるというのはCNNがすごいのかt-SNEがいまいちなのかなんなんだ。 というかMNISTのデータはなんであんなに綺麗に描けるんだ。
どの点がどの画像なのかを見る。
数字ごとに分けて書いた図を見ているとどうもMNISTとFaxOCRで被っている点もある。その点がどの点なのかを見ることで、何かわかるんじゃないかと思って、以下のように可視化した。
MNISTとFaxOCRの点が重なっているところで緑とかになっているのは、直すのがめんどうなだけなので気にしないでほしい。(これ系の図のもっと楽な書き方を知っている人がいたら教えて欲しいです…)
img_size = 28 * 100
label = np.r_[mnist_label[indecies].reshape(num_mnist, -1), faxocr_label.reshape(len(faxocr_data),-1)]
positions = (tsned - tsned.min()) *img_size/(tsned.max() - tsned.min())
plt.figure(figsize=(50*2,50*5))
for num in range(10):
    plt.subplot(5,2,num+1)
    img = np.ones((img_size, img_size, 3))
    for i, pos in enumerate(positions):
        if label[i] != num:
            continue
        temp = data[i].reshape(28,28)
        if i < num_mnist:
            temp = np.c_[ np.zeros([784]), data[i], data[i]]
        else:
            temp = np.c_[data[i], data[i],  np.zeros([784])]
        temp = temp.reshape(28,28,3)


        if pos[0]-14<0 or pos[0]+14>img_size or pos[1]-14<0 or pos[1]+14>img_size:
            continue
        img[pos[0]-14:pos[0]+14, pos[1]-14:pos[1]+14, :] -= temp

    plt.imshow(img)
    plt.title(num)
    #plt.savefig("./results/tsne%d.png"%num)
    #plt.savefig("./results/tsne%d.eps"%num)
plt.show()
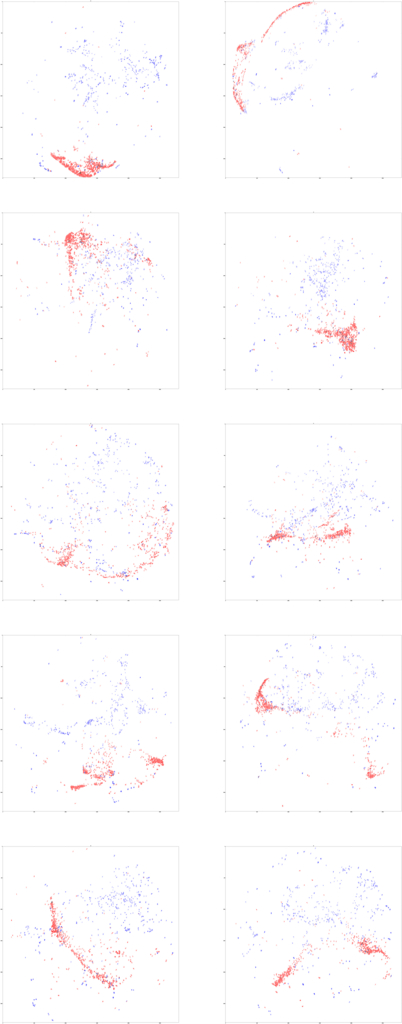
図をぼんやり眺めていると、「これ字のサイズが違うだけじゃね」って思い始めた。 (図が縮小されてわからないと思うので、こちらに元サイズの画像をおいた。ちなみに5492x13993ある。)
画像中の文字の大きさを統一する
FaxOCRのデータは元データをそのまま入力しているので、大きさが統一されていない。MNISTのデータも色々な大きさの数字が混ざっているんだろうと思い込んでいたんだけど、どうもそうでもないみたい。 ちゃんと公式サイトみると、
"The digits have been size-normalized and centered in a fixed-size image."
って書いてあった。
というわけで同様の処理をFaxOCRのデータにも行う。 トリミングして数字を画像の中心にもってきてってやるの、ちゃんとプログラム書くとそこそこめんどうだなぁと思っていたけど、 ImageMagickで探してみたら意外とあったので、以下のようにコマンドを叩いてぱぱっとやる。 こちらとこちらを参考にした。
for i in *
do
convert -fuzz %60 -trim $i ../trim/$i
done
cd ../trim
for i in *
do
convert $i -background white -gravity center -thumbnail 28x28 -extent 28x28 ../trim_28/$i
done
余白の設定がめんどうだったので、FaxOCRだけでなくMNISTのデータにも適応した。
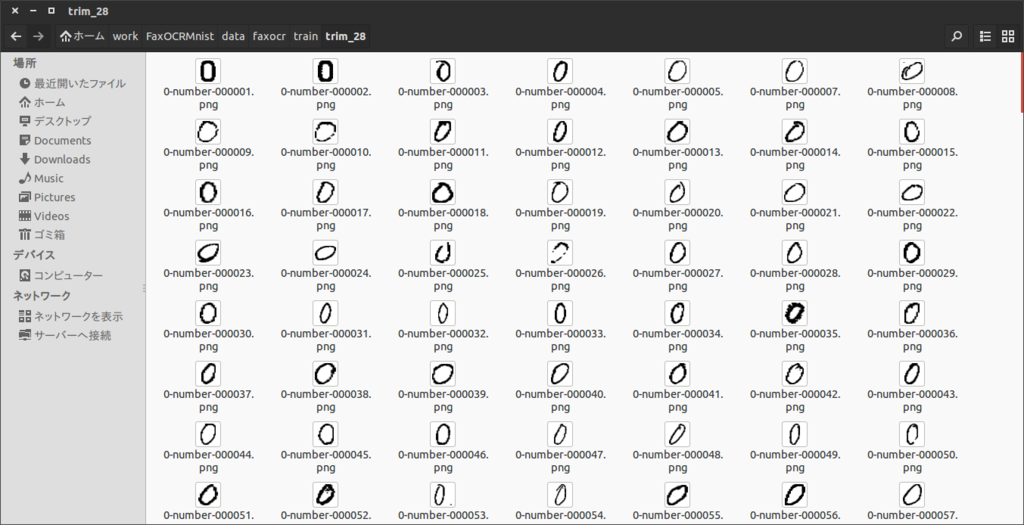
できた画像は以下のような感じ
再びt-SNE
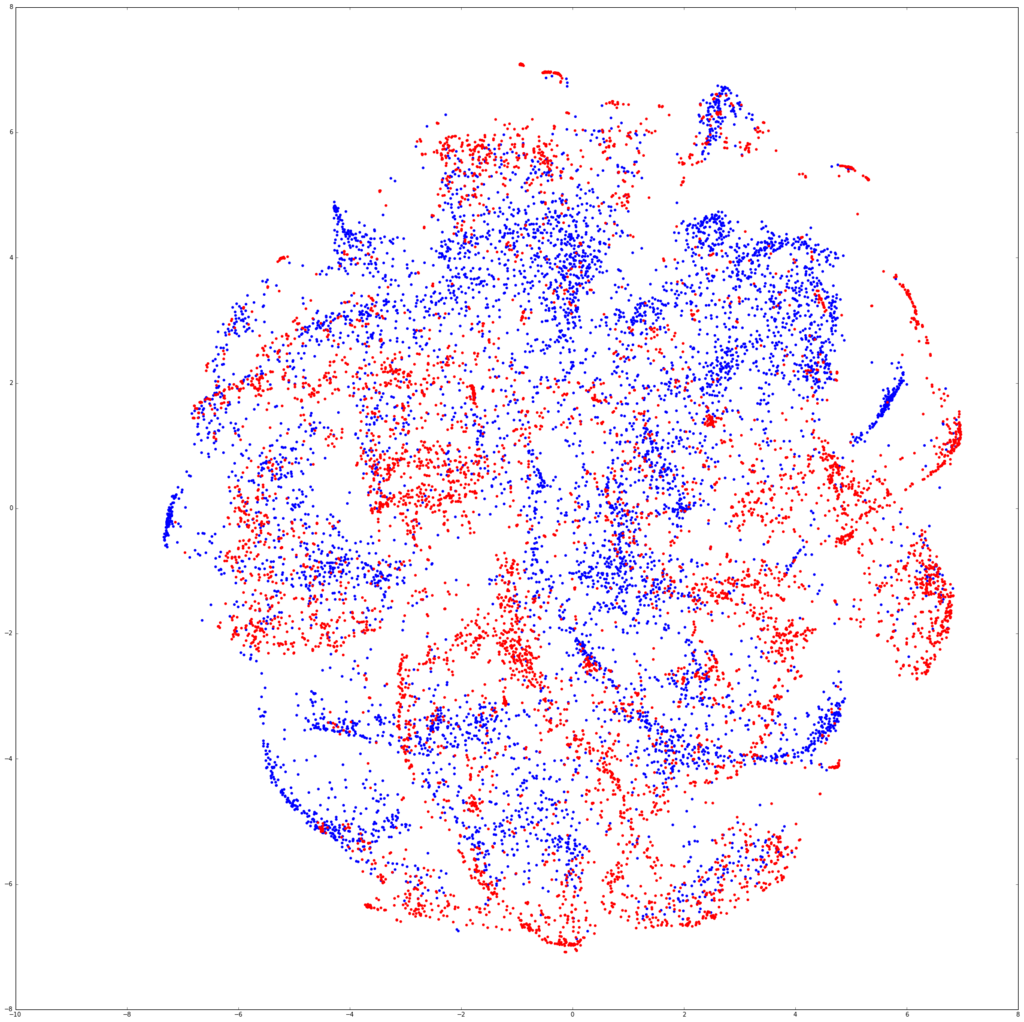
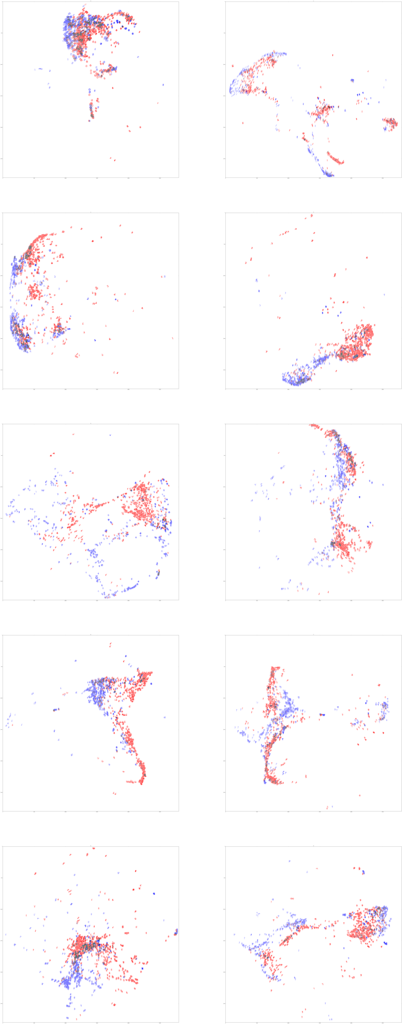
サイズを調整した画像を再びt-SNEに突っ込んで可視化する。
from learn import read_imgs

mnist_data,  mnist_label  = read_imgs("./data/mnist/train/trim_28")
faxocr_data, faxocr_label = read_imgs("./data/faxocr/train/trim_28")

print mnist_data.mean()
print faxocr_data.mean()
num_mnist = 7000

import random
indecies = random.sample(range(len(mnist_data)), num_mnist)

data = np.r_[mnist_data[indecies].reshape(num_mnist, -1), faxocr_data.reshape(len(faxocr_data),-1)]
0.298007055179
0.206816194953
from sklearn.manifold import TSNE
model = TSNE(n_components=2)
tsned = model.fit_transform(data)
label = np.r_[["b" for i in range(num_mnist)], ["r" for i in faxocr_data]]
plt.figure(figsize=(30,30))
plt.scatter(tsned[:,0], tsned[:,1], c=label, linewidths=0)
plt.show()
img_size = 28 * 100
label = np.r_[mnist_label[indecies].reshape(num_mnist, -1), faxocr_label.reshape(len(faxocr_data),-1)]
positions = (tsned - tsned.min()) *img_size/(tsned.max() - tsned.min())
plt.figure(figsize=(50*2,50*5))
for num in range(10):
    plt.subplot(5,2,num+1)
    img = np.ones((img_size, img_size, 3))
    for i, pos in enumerate(positions):
        if label[i] != num:
            continue
        temp = data[i].reshape(28,28)
        if i < num_mnist:
            temp = np.c_[ np.zeros([784]), data[i], data[i]]
        else:
            temp = np.c_[data[i], data[i],  np.zeros([784])]
        temp = temp.reshape(28,28,3)


        if pos[0]-14<0 or pos[0]+14>img_size or pos[1]-14<0 or pos[1]+14>img_size:
            continue
        img[pos[0]-14:pos[0]+14, pos[1]-14:pos[1]+14, :] -= temp

    plt.imshow(img)
    plt.title(num)
    #plt.savefig("./results/tsne%d.png"%num)
    #plt.savefig("./results/tsne%d.eps"%num)
plt.show()
model_faxocr = TSNE(n_components=2)
tsned_faxocr = model_faxocr.fit_transform(faxocr_data.reshape(len(faxocr_data),-1))

plt.figure(figsize=(30,30))
plt.scatter(tsned_faxocr[:,0], tsned_faxocr[:,1], c=faxocr_label, linewidths=0)
plt.show()
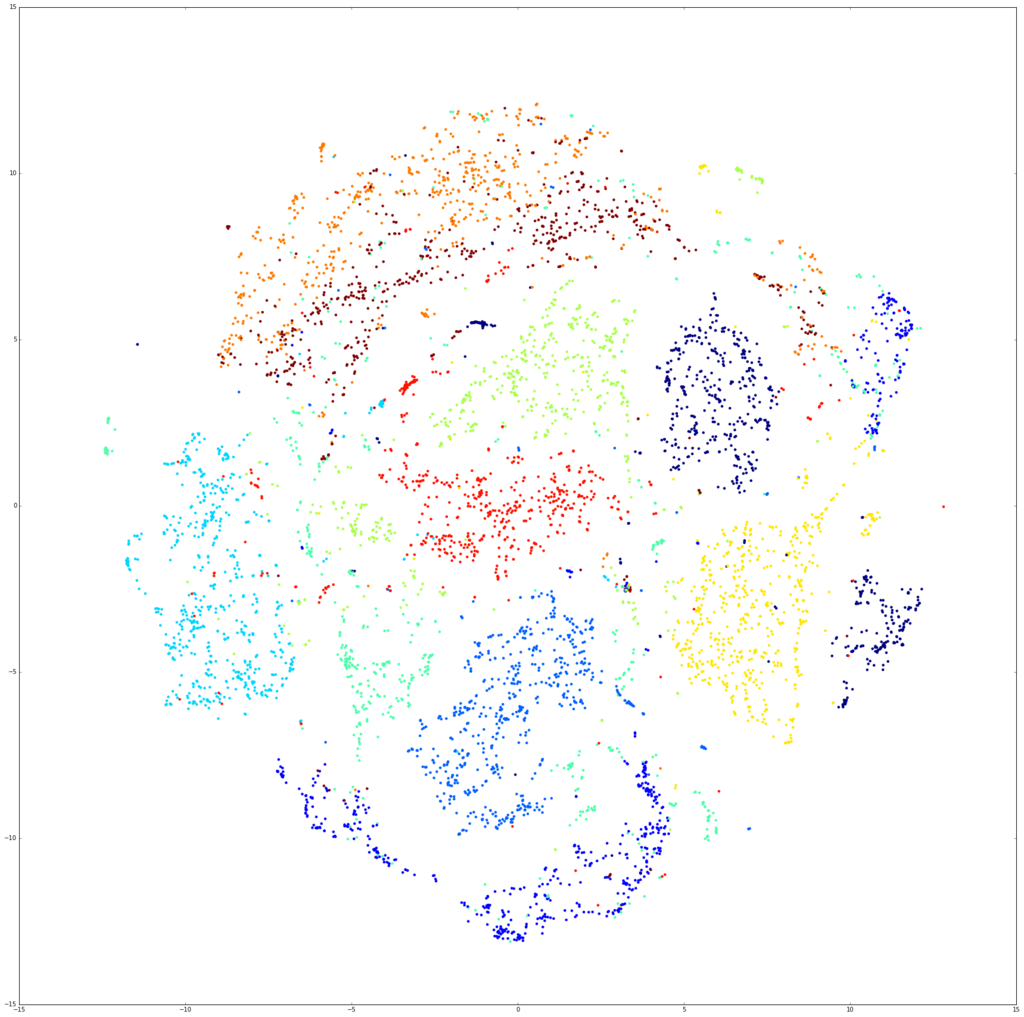
あ、これいけるわ。
再びCNN
いけそうなのでCNNに突っ込んだ。結果は以下。
fig = plt.figure(figsize=[20,10])
plt.subplot(121)
accuracy = pd.read_csv("./results/mnist_trim_28_accuracy_row.txt", sep="\t")
loss = pd.read_csv("./results/mnist_trim_28_loss_row.txt", sep="\t")
print accuracy
accuracy["test_accuracy"].plot()
plt.ylim([0,1])
loss["train_loss"].plot()
plt.title("MNIST trim -> FaxOCR trim")
plt.subplot(122)
accuracy = pd.read_csv("./results/mnist_28_accuracy_row.txt", sep="\t")
loss = pd.read_csv("./results/mnist_28_loss_row.txt", sep="\t")
accuracy["test_accuracy"].plot()
plt.ylim([0,1])
loss["train_loss"].plot()
plt.title("MNIST->FaxOCR")
plt.show()
        epoch  test_accuracy
    0       1       0.787149
    1       2       0.867470
    2       3       0.895582
    3       4       0.947791
    4       5       0.931727
    5       6       0.923695
    6       7       0.931727
    7       8       0.955823
    8       9       0.935743
    9      10       0.939759
    10     11       0.927711
    11     12       0.959839
    12     13       0.955823
    13     14       0.955823
    14     15       0.931727
    15     16       0.931727
    16     17       0.923695
    17     18       0.951807
    18     19       0.935743
    19     20       0.951807
    20     21       0.951807
    21     22       0.959839
    22     23       0.951807
    23     24       0.955823
    24     25       0.939759
    25     26       0.963855
    26     27       0.951807
    27     28       0.959839
    28     29       0.963855
    29     30       0.955823
    30     31       0.963855
    31     32       0.951807
    32     33       0.967871
    33     34       0.967871
    34     35       0.967871
    35     36       0.963855
    36     37       0.979920
    37     38       0.959839
    38     39       0.967871
    39     40       0.971888
    40     41       0.951807
    41     42       0.967871
    42     43       0.959839
    43     44       0.967871
    44     45       0.971888
    45     46       0.971888
    46     47       0.947791
    47     48       0.927711
    48     49       0.959839
    49     50       0.927711
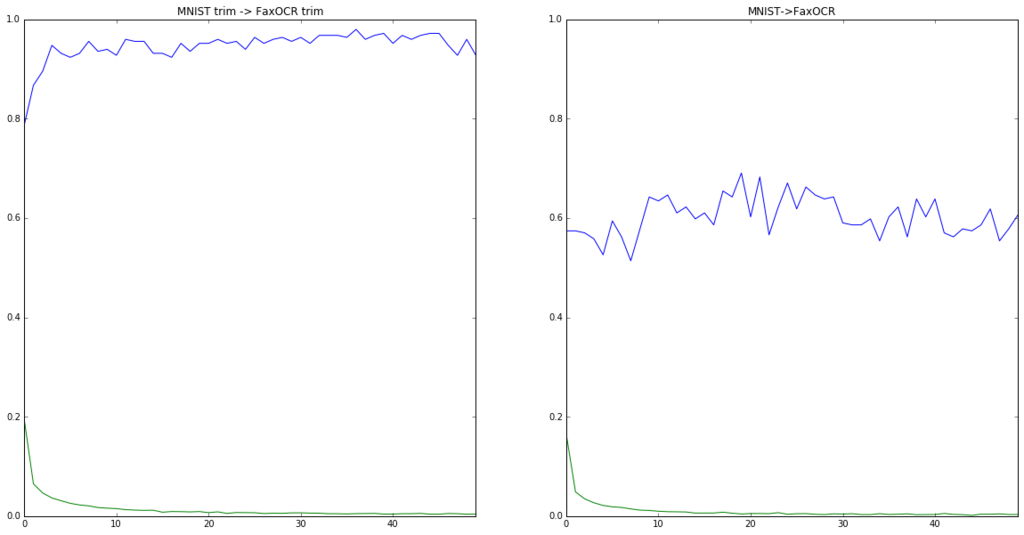
MNISTだけで学習したCNNを使って、無事90%を超えるぐらいの精度は出すことができた。
右は最初にやった正規化していないデータ。
おわりに
normalize大事という意識は今までもあったつもりだったけど、正直ここまでとは思ってなかった。 今回は特にnormalizeされたデータであるMNISTのデータを使って、normalizeされてないFaxOCRのデータを認識しようとしていたのが良くなかった。実際にFaxOCRのデータでFaxOCRのデータを予測すると、それなりに上手くいっていた。CNNがきちんと学習してくれていたんだと思う。
一方でt-SNEを、正規化していないFaxOCRのデータに対して適用すると、かなりまずいことになっていた。今までなんとなくt-SNEに突っ込んで学習できそうかどうか見るというのをよくやっていたけど、もう少し気をつけたほうが良さそう。まずはt-SNEの論文をちゃんと読もうと思った。
おまけ
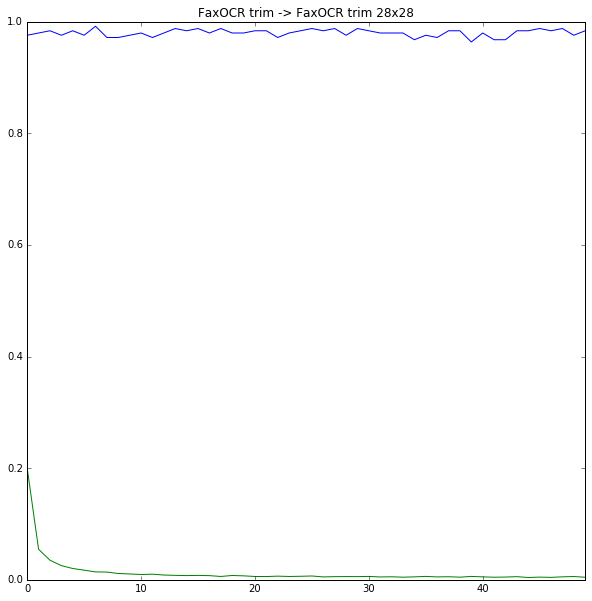
正規化したFaxOCRのデータを使って正規化したFaxOCRのデータを当てにいった。結果は以下。
28x28
fig = plt.figure(figsize=[10,10])
accuracy = pd.read_csv("./results/faxocr_trim_28_accuracy_row.txt", sep="\t")
loss = pd.read_csv("./results/faxocr_trim_28_loss_row.txt", sep="\t")
print accuracy
accuracy["test_accuracy"].plot()
plt.ylim([0,1])
loss["train_loss"].plot()
plt.title("FaxOCR trim -> FaxOCR trim 28x28")
plt.show()
        epoch  test_accuracy
    0       1       0.975904
    1       2       0.979920
    2       3       0.983936
    3       4       0.975904
    4       5       0.983936
    5       6       0.975904
    6       7       0.991968
    7       8       0.971888
    8       9       0.971888
    9      10       0.975904
    10     11       0.979920
    11     12       0.971888
    12     13       0.979920
    13     14       0.987952
    14     15       0.983936
    15     16       0.987952
    16     17       0.979920
    17     18       0.987952
    18     19       0.979920
    19     20       0.979920
    20     21       0.983936
    21     22       0.983936
    22     23       0.971888
    23     24       0.979920
    24     25       0.983936
    25     26       0.987952
    26     27       0.983936
    27     28       0.987952
    28     29       0.975904
    29     30       0.987952
    30     31       0.983936
    31     32       0.979920
    32     33       0.979920
    33     34       0.979920
    34     35       0.967871
    35     36       0.975904
    36     37       0.971888
    37     38       0.983936
    38     39       0.983936
    39     40       0.963855
    40     41       0.979920
    41     42       0.967872
    42     43       0.967871
    43     44       0.983936
    44     45       0.983936
    45     46       0.987952
    46     47       0.983936
    47     48       0.987952
    48     49       0.975904
    49     50       0.983936
何気に記録更新だった。たまたま感あるけど。
import cPickle as pickle
import chainer
from chainer import cuda
import chainer.functions as F

def forward(x_data, y_data):
    x, t = chainer.Variable(x_data), chainer.Variable(y_data)
    h = F.max_pooling_2d(F.relu(model.conv1(x)), 2)
    h = F.max_pooling_2d(F.relu(model.conv2(h)), 2)
    h = F.dropout(F.relu(model.l1(h)), train=False)
    y = model.l2(h)

    return y, t,F.accuracy(y,t)

with open("./results/faxocr_trim_28_model_cnn_row.pkl", 'rb') as i:
    model = pickle.load(i)
from learn import read_imgs
test_data, test_label = read_imgs("./data/faxocr/test/trim_28")

test_data = test_data.reshape((len(test_data), 1, 28, 28))
test_data = test_data.astype(np.float32)
test_label = test_label.astype(np.int32)

y,t,acc = forward(test_data, test_label)
plt_num = 1
plt.figure(figsize=(10,10))
for i,(temp_y,temp_t,temp_test_data) in enumerate(izip(y.data,t.data, test_data)):
    if np.argmax(temp_y)!=temp_t:
        print "No.%d 正解:%d 出力:%d (%s)"%(i,temp_t, np.argmax(temp_y),temp_y)
        plt.subplot(2,2,plt_num)
        plt_num+=1
        plt.imshow(temp_test_data.reshape(28,28), cmap=plt.cm.gray_r)
plt.show()
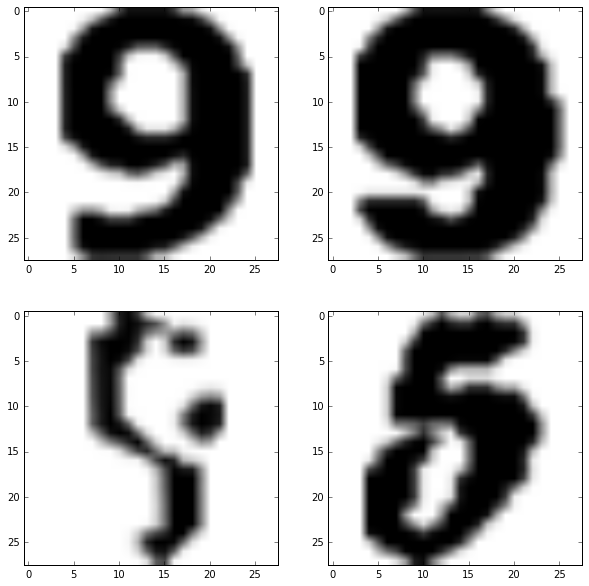
    No.133 正解:9 出力:3 ([ -93.78523254  -76.56691742  -77.28510284   15.78890038  -87.52314758
      -58.99074554 -176.7293396  -101.68743896  -67.08155823   14.66318226])
    No.205 正解:9 出力:3 ([-44.00131989 -30.13937569 -40.71391678  17.24973297 -49.49590683
     -39.89061356 -82.53543091 -53.00856781   3.72428441   3.67775631])
    No.223 正解:9 出力:5 ([-24.54581642 -29.07642365 -31.50553131 -19.87841034 -23.92304039
      22.30206299 -18.75444031  -1.30475843 -20.22147751 -21.81653404])
    No.239 正解:5 出力:6 ([-12.27904129 -23.67368317 -23.48480606 -15.10187721 -11.83357048
       2.34730673   4.19125843 -13.38466549  -3.61155844 -24.05160713])
48x48
fig = plt.figure(figsize=[10,10])
accuracy = pd.read_csv("./results/faxocr_trim_48_accuracy_row.txt", sep="\t")
loss = pd.read_csv("./results/faxocr_trim_48_loss_row.txt", sep="\t")
print accuracy
accuracy["test_accuracy"].plot()
plt.ylim([0,1])
loss["train_loss"].plot()
plt.title("FaxOCR trim -> FaxOCR trim 48x48")
plt.show()
        epoch  test_accuracy
    0       1       0.967871
    1       2       0.967871
    2       3       0.971888
    3       4       0.971888
    4       5       0.959839
    5       6       0.975904
    6       7       0.967871
    7       8       0.967871
    8       9       0.975904
    9      10       0.971888
    10     11       0.975904
    11     12       0.979920
    12     13       0.963855
    13     14       0.975904
    14     15       0.975904
    15     16       0.971888
    16     17       0.967871
    17     18       0.963855
    18     19       0.967871
    19     20       0.975904
    20     21       0.967871
    21     22       0.963855
    22     23       0.975904
    23     24       0.971888
    24     25       0.967871
    25     26       0.967871
    26     27       0.971888
    27     28       0.971888
    28     29       0.963855
    29     30       0.963855
    30     31       0.975904
    31     32       0.967871
    32     33       0.963855
    33     34       0.979920
    34     35       0.971888
    35     36       0.967871
    36     37       0.979920
    37     38       0.979920
    38     39       0.967871
    39     40       0.975904
    40     41       0.975904
    41     42       0.975904
    42     43       0.975904
    43     44       0.979920
    44     45       0.975904
    45     46       0.979920
    46     47       0.979920
    47     48       0.975904
    48     49       0.975904
    49     50       0.975904
import cPickle as pickle
import chainer
from chainer import cuda
import chainer.functions as F

def forward(x_data, y_data):
    x, t = chainer.Variable(x_data), chainer.Variable(y_data)
    h = F.max_pooling_2d(F.relu(model.conv1(x)), 2)
    h = F.max_pooling_2d(F.relu(model.conv2(h)), 2)
    h = F.dropout(F.relu(model.l1(h)), train=False)
    y = model.l2(h)

    return y, t,F.accuracy(y,t)

with open("./results/faxocr_trim_48_model_cnn_row.pkl", 'rb') as i:
    model = pickle.load(i)
from learn import read_imgs
test_data, test_label = read_imgs("./data/faxocr/test/trim_48")

test_data = test_data.reshape((len(test_data), 1, 48, 48))
test_data = test_data.astype(np.float32)
test_label = test_label.astype(np.int32)

y,t,acc = forward(test_data, test_label)

plt_num = 1
plt.figure(figsize=(10,10))
for i,(temp_y,temp_t,temp_test_data) in enumerate(izip(y.data,t.data, test_data)):
    if np.argmax(temp_y)!=temp_t:
        print "No.%d 正解:%d 出力:%d (%s)"%(i,temp_t, np.argmax(temp_y),temp_y)
        plt.subplot(3,2,plt_num)
        plt_num+=1
        plt.imshow(temp_test_data.reshape(48,48), cmap=plt.cm.gray_r)
plt.show()
No.31 正解:7 出力:3 ([-37.6387825  -39.16486359 -42.47499466  16.941082   -35.50929642
 -28.37680244 -50.37080765 -18.17589951 -43.64836502 -26.19575882])
No.185 正解:3 出力:7 ([-21.7053051  -26.57409286 -22.67599106   5.41281748 -29.81308937
 -15.2016449  -49.91247177  11.7005167  -18.8066597  -14.08572674])
No.223 正解:9 出力:5 ([-26.99477196 -24.89096451 -43.02868652 -15.52783775 -25.02332115
  22.98989105 -17.69327545 -12.22776604 -12.18619633 -25.91065407])
No.228 正解:8 出力:9 ([ -4.70918608 -52.99452972 -28.40055275 -29.08706474   6.42821693
 -24.2097435  -52.58614731 -46.19430542 -14.41009426  12.67389202])
No.229 正解:2 出力:8 ([-22.11865997 -47.65965271  -1.94437969 -54.52325821 -24.92860031
 -19.47817802 -17.64678574 -40.01361084  26.35980225 -27.82418633])
No.239 正解:5 出力:8 ([ -3.87564874 -33.8475914  -27.65610313 -16.90502548 -28.28848457
 -23.67333221  -2.17319727 -35.55740356  22.8358345  -31.50007057])
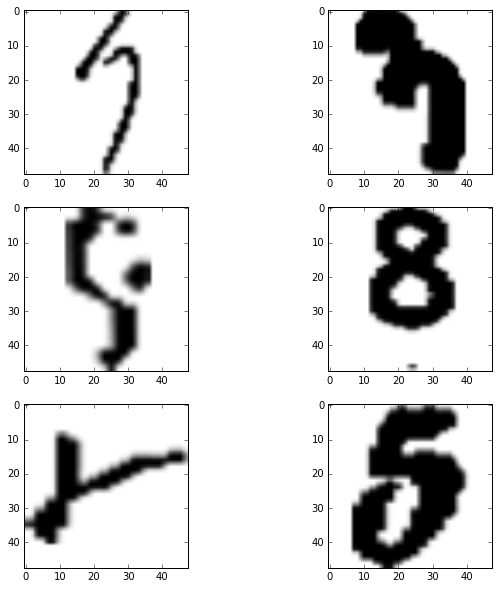
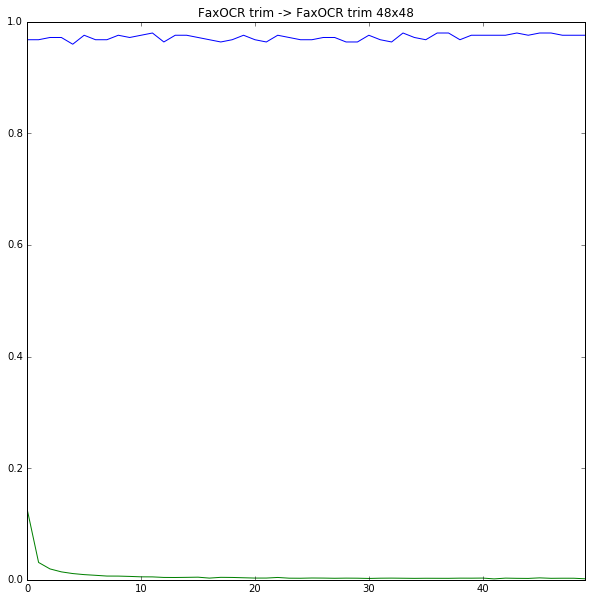
間違えちゃいけないデータを間違えているような気もするけど、前処理が適当で画像ぼけてるのがあれかも。 あとMNISTのデータとFaxOCRのデータをくっつけると汎化性能とか上がっていい感じかも。
あとは、データのaugmentationをもうちょっとちゃんとやるとか、複数のCNNでアンサンブル的なやつとかと思うけど、そのへんはよくわかってない